CRE Market Risk Heat Map: AI-Powered Risk Scoring in Minutes (Updated June 2026)
Picture two analysts. Same deal, same market, same deadline.
The first one opens three browser tabs: a CBRE market report from last quarter, a CoStar snapshot, and a news article about a new industrial development two miles from the subject property.
She starts building a risk table in PowerPoint, manually typing in vacancy trends, checking employment numbers on the Bureau of Labor Statistics website, and cross-referencing absorption data from two different sources that don’t quite agree. Four hours in, she has a solid draft. Two more hours of formatting later, she has a polished risk slide, with an IC meeting that starts in the morning.
The second analyst opens Claude, pastes a system prompt, types in a list of risk factors for the same market, and hits enter.
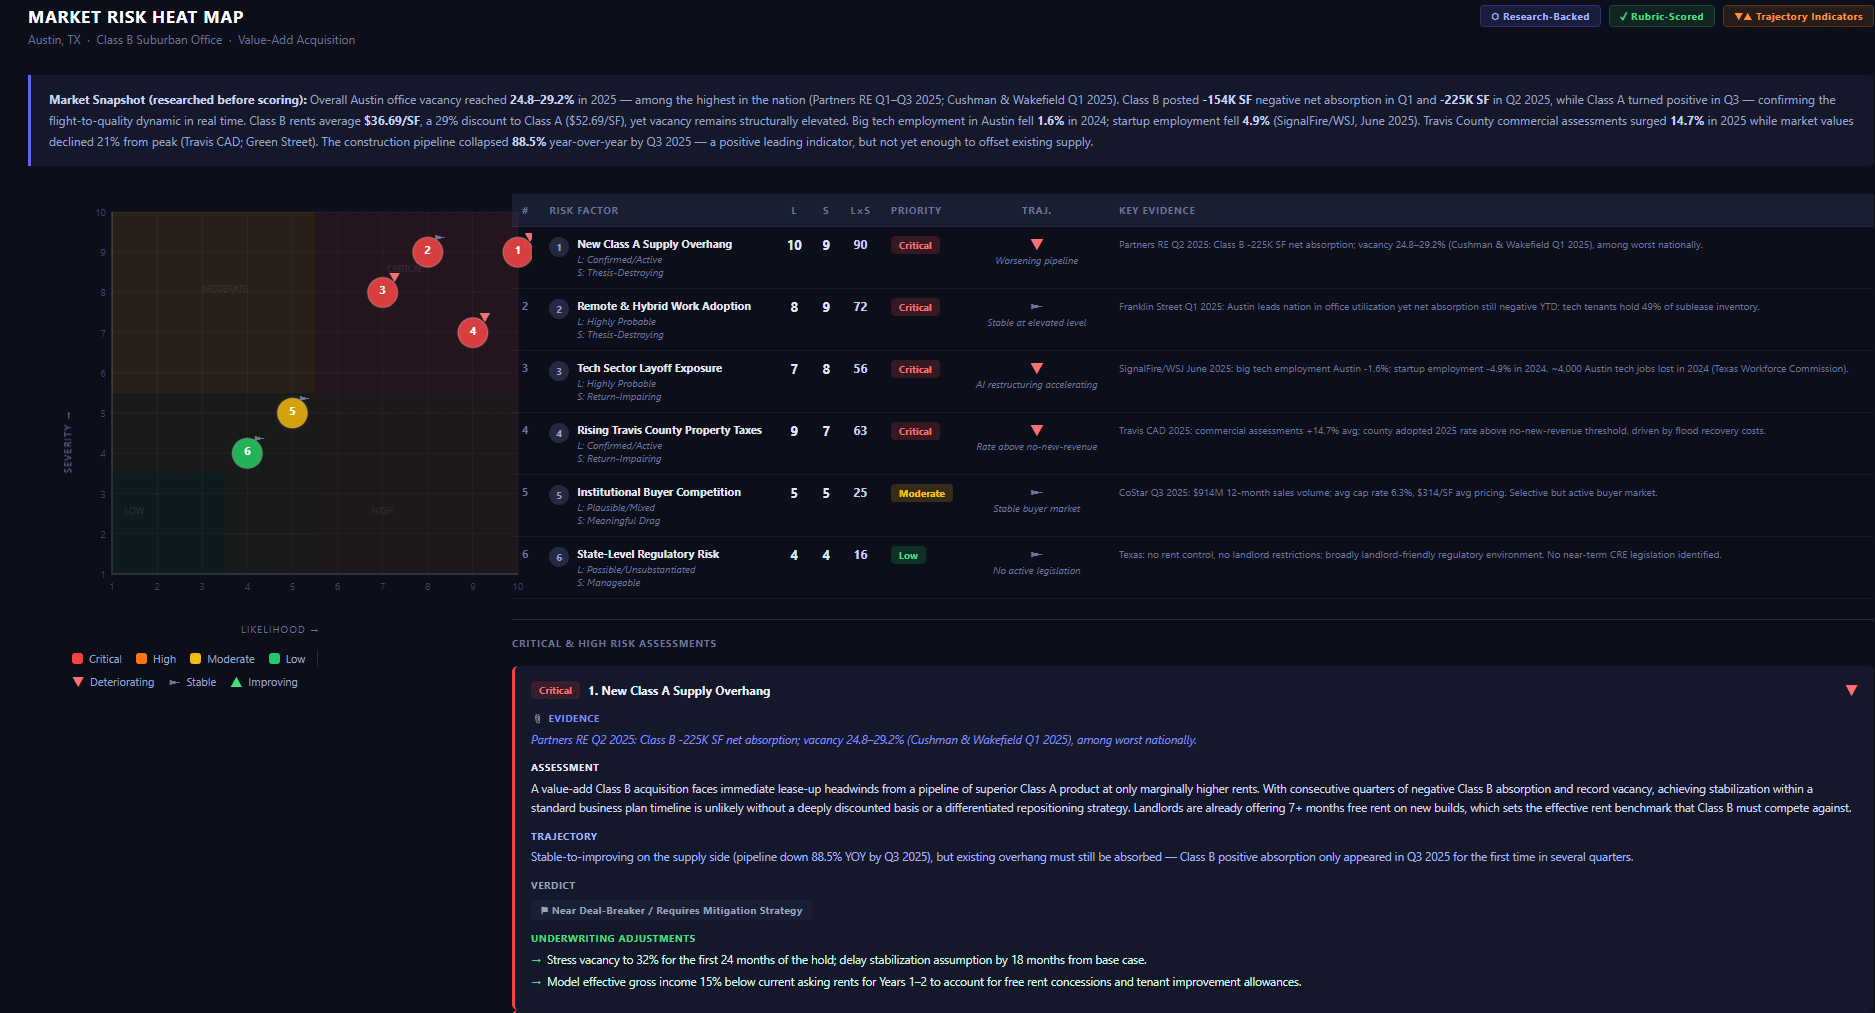
Five minutes later? A fully sourced, scored, and visualized risk assessment, complete with a heat map, trajectory indicators, and model-ready underwriting adjustments for every critical and high-risk factor identified.
Same deal. Same market. Same deadline. Very different afternoons.
Turn market risk assessment from a half-day task into a 5-minute workflow
Why Commercial Real Estate Risk Assessment Falls Short: What to Do About It
Commercial real estate risk assessment is something every deal team does. But almost none do it in a way that is fast, consistent, sourced, and actually connected to the financial model.
The typical output is one of two things: a bullet list that a senior professional wrote from memory (valuable instinct, zero audit trail), or a junior analyst spending four to six hours synthesizing quarterly broker reports into a risk slide that will be stale by the time it’s reviewed.
Neither is auditable. Neither is comparable across deals. Neither tells the underwriter: here’s what to adjust, and by how much.
And neither scales.
How the Market Risk Heat Map AI Prompt Works
The Market Risk Heat Map is a structured AI workflow, a Claude system prompt, that turns a list of user-provided risk factors into a fully sourced, scored, and visualized risk assessment in about 3 to 5 minutes.
Here’s what it actually does under the hood:
Before scoring a single risk, the prompt instructs Claude to research the market live. It pulls current data from broker reports, county appraisal records, employment databases, and news sources at run time, not from training data. Then it applies anchored scoring rubrics, so every likelihood and severity score is tied to a specific tier definition and a cited data point.
Not intuition. Not vibes. Actual anchored scores backed by sourced data.
The output? A complete risk assessment package, delivered in a single run.
CRE Market Risk Analysis: Full Output in a Single 3–5 Minute Run
- A scored risk table with rubric-anchored likelihood and severity scores and a trajectory indicator per risk (is this risk getting better, worse, or holding steady?)
- A visual heat map, an HTML file you can share, plotting each risk by position and direction of travel
- Written assessments for every Critical and High risk, each closing with specific, model-ready underwriting adjustments
That last part is what makes this different. It doesn’t just tell you a risk is “high.” It tells you what to do about it in the model.
Watch the AI-Powered CRE Risk Heat Map in Action
AI Tools Behind the CRE Market Risk Heat Map: No Setup Required
This prompt runs entirely inside Claude.ai with web search enabled. That’s it.
| Tool | What It Does |
|---|---|
| Claude Sonnet (claude.ai) | Orchestrates the full workflow: collects inputs, researches the market live, applies scoring rubrics, assigns trajectory ratings, writes risk narratives, and generates the HTML heat map |
| Web Search (built into Claude) | Pulls live market data from CBRE, JLL, Cushman & Wakefield, CoStar, and others, sourced at run time |
| HTML / Canvas (generated by Claude) | Produces a self-contained, shareable heat map with trajectory arrows, zone shading, and source citations |
No external APIs. No code. No setup. Paste the prompt, start the conversation, and get the output.
Download the Prompt
We’re launching a new resource series on A.CRE: standout AI prompts for commercial real estate, published and ready to use.
See the output first. Grab the prompt. Run it in Claude and put hours back in your day.
Works for any market, any asset class, and any investment strategy. Give it your risks, and let it do the research.
Note: After publishing the Market Risk Heat Map prompt, I decided to take it further and build it into a proper web app. The result is CRE Risk Intelligence – an AI agent web app that autonomously researches live market data, scores every risk, and returns IC-ready output in under 90 seconds. No setup. No API key. Any market, any asset class, any strategy. You can find it on the AI.Edge platform in the Pro AI Multiplier section, where it joins a growing library of tools built specifically for commercial real estate professionals.
The sharpest CRE minds are already using AI to work faster, underwrite smarter, and win more deals. Join them at AI.Edge

