Using Development Spread in Real Estate Analysis (Updated Jun 2024)
Real estate developments carry inherent risks, making them one of the most challenging investment opportunities. However, the potential for profit can justify the risks involved. Have you ever wondered how to assess the profit potential behind a real estate development? How can you determine if investing in real estate development is worthwhile? In this article, we will delve into the concept of “Development Spread” to shed light on these questions.

Visualizing the Risk of a Real Estate Opportunity
I should start by stating that all real estate investment opportunities are classified based on the risk they pose, which in turn determines the expected return. You may have heard the saying, “The riskier the real estate investment, the higher the potential return.”
Imagine being part of a real estate investment team when an opportunity arises to acquire a high-quality “office building.” This property is well-maintained, located in a prime area of the city, and has long-term lease contracts with a low vacancy rate.
Based on these factors, we can conclude that it is a low-risk opportunity. Moreover, it appears to be a property that is stabilized, and generating consistent and nearly guaranteed long-term income.
However, when considering the expected return on such an investment, it becomes evident that the anticipated return to an investor on the cash flow based on a market purchase price of this type of asset would be quite low. So, what justifies this outcome of a low return? The reason is that the purchase price the market would be willing to pay for a property with such characteristics is considerably higher compared to other properties thereby reducing the yield received on the cash flow.
A Higher-Risk Venture: Land Development for an Office Building
Now, let’s explore a different real estate investment opportunity. Imagine a scenario where the opportunity involves horizontal and vertical land development to construct a similar “Office Building” on the outskirts of the city’s business center and residential area.
This type of opportunity carries much higher risk. Why? Because it entails building real estate from the ground up and subsequently leasing it. It may involve navigating through an entitlement phase and obtaining approvals for the property’s design and construction.
I recommend you take a look at Spencer’s Land Development Model
Additionally, construction costs can vary depending on factors such as labor availability and timing. Moreover, there is the risk associated with selling the property once the project is completed.
However, for a sophisticated developer, the expected returns are higher compared to buying a comparable building already stabilized due to purchasing the yet-to-be-developed property at an appropriate price so that the all-in development costs are lower than the all-in costs to purchase an already built comparable property. And, if all goes well and the developer successfully navigates all the risks, this compensates and rewards the developer for taking on the risk of developing when compared to simply buying a stabilized comparable property.
Yes, in real estate development, there is significant value creation!
Measuring the Development Spread
During my work on Course 5 of the Real Estate Financial Model Accelerator program, which focuses on calculating risk and return indicators for making sound investment decisions, I came across an important metric known as the “Development Spread.”
In Course 12, where the cash flow of a real estate development is modeled, I delved deeper into this metric that enables us to measure the potential benefit associated with a real estate development project.
Development Spread (bps) = (Yield-on-Cost – Market Cap Rate) x 10,000
In simple terms, the Development Spread calculates the difference in return between the two types of real estate opportunities we discussed earlier when visualizing the risk. Let’s break down the formula step by step for better comprehension.
Understanding Basis Points (bps)
Basis points (bps) are a standard measure used in finance to represent changes in percentages or rates. For example, 100 basis points equal a 1% change.
If you hear that a 6% market cap rate has increased by 50 basis points after 10 years, the new market cap rate would be:
Exit cap rate = 6% + 50/10000 = 6.5%
Yield-on-Cost
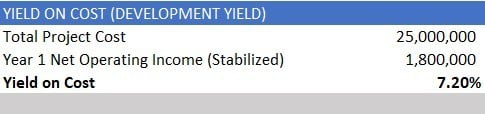
The measure of Yield-on-Cost is calculated by dividing the stabilized “Net Operating Income (NOI)” by the total project cost.
Yield-on-Cost = Annual Net Operating Income at Stabilization ÷ Total Project Cost
Also known as Development Yield, it can be seen as a market cap rate since it represents the first year’s return, or a given year’s NOI, divided by the total project costs.
Market Cap Rate
Simply put, the capitalization rate allows you to estimate the return that would be obtained on a real estate investment. It is called “market” because investors look at the rates established in the market to establish a reference of how much they could pay for a real estate property.
The capitalization rate estimates the return generated from a real estate investment. Investors reference the market rates to determine how much they should pay for a property.
Market Cap Rate = Stabilized Annual NOI ÷ Asset Value
Case Study using Development Spread
In our case study, we will explore the calculation of the Development Spread for an “Office Building” development project. However, it’s important to note that this metric should be analyzed alongside other indicators such as the Internal Rate of Return (IRR) and the Equity Multiple.
I recommend you consult the Bite-Sized Real CRE Lessons – A.CRE 30 Second Video Tutorials and our Glossary of Terms, to clarify any doubts regarding a certain term.
Based on the two examples mentioned when we were visualizing the risk of a real estate opportunity, let’s imagine that the land costs, direct and soft costs, capitalized construction interest, financing fees, and the operating shortfall, sum up to a total cost of the office building development project of $25,000,000.
Likewise, the stabilized first-year net operating income is $1,800,000. This would result in a Development Yield of 7.2%.
Also, imagine that the office buildings similar to the property we are developing have been trading on the market at a cap rate between 4.5% and 5.5% for the last year.
In this sense, we must select a rate among such values, so, after comparing the properties, we conclude that a market capitalization rate (today) according to the development of the office building must be 5 %.
Finally, if we calculate the indicator of the “Development Spread of the Office Building” we obtain a potential benefit of:
Development Spread (bps) = (7.2% – 5%) x 10,000 = 220 bps
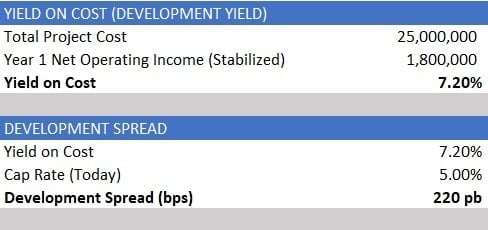
This indicates a 220 basis point difference in performance between the two options: a stabilized “Office Building” at the market cap rate versus the construction and leasing of a new office building. A higher Development Spread suggests greater potential benefit since real estate developments inherently carry more risk.
Additionally, it’s important to note that the market cap rate serves as a valuable reference. The further the project’s rate deviates from it, the more financially feasible the project is considered.
Requiring a Greater Development Spread
Let’s imagine that the investment team is looking for a development spread of 240 bp. What could we do as real estate professionals?
When real estate financial models are built, the models are designed to analyze key metrics or indicators, such as the “IRR”, the “Equity Multiple”, the “Development Spread”, etc.
That is to say, in most cases, the purchase price of the land and the development costs of a project, in general, are inputs, as well as the amount of the rent once the property is built.
Therefore, if an investor wishes to obtain an internal rate of return, an equity multiple, and a given development spread, the work could be in adjusting, for example, the purchase price of the land or the direct and soft costs for obtaining the required performance.
Let me show you an excellent tool included in “MS Excel”!
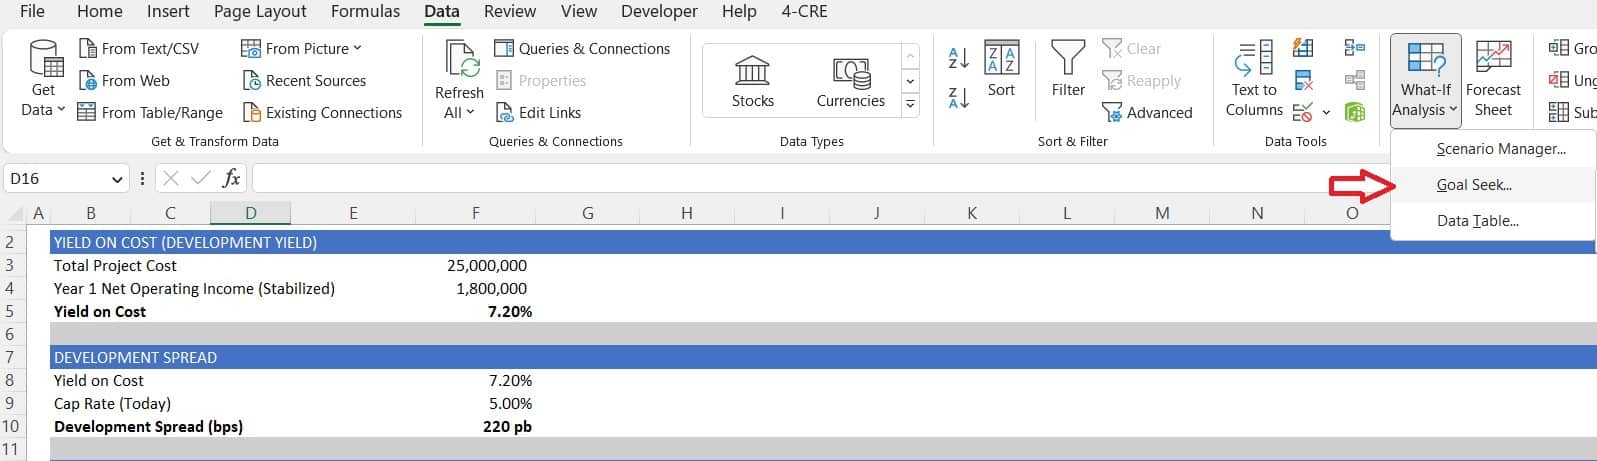
What if Analysis
If 240 bps of development spread is required, we can go to the “Data” tab of “MS Excel”, then click on “What if Analysis” and finally select the “Goal Seek” option.
Then, “Set cell.” In this case, we must set “Cell F10” and then “To value” of 240 bps. Next, we do “By changing cell” as “Cell F3”.
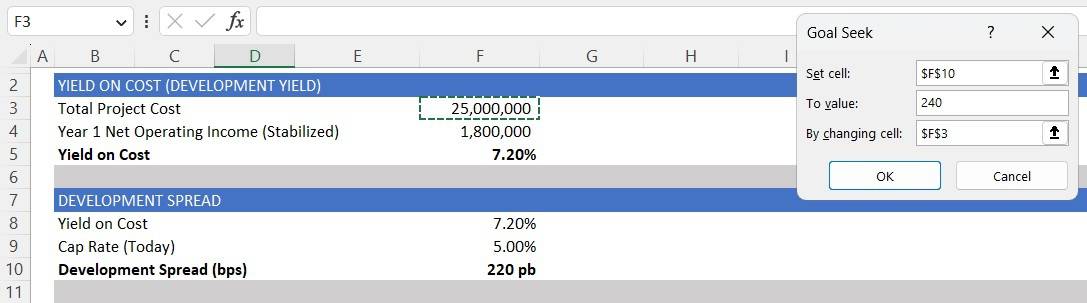
Finally, click on “Ok”.
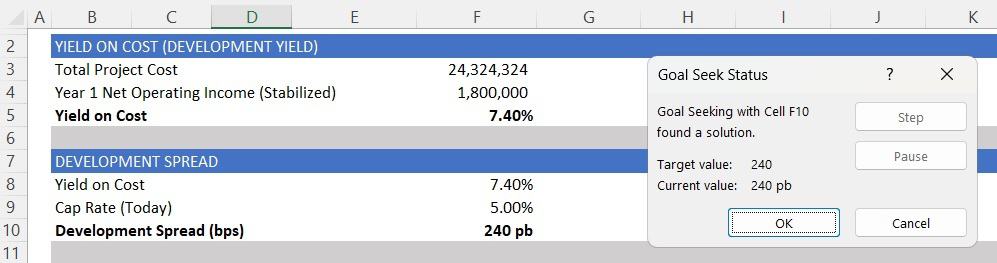
Now, we can properly inform the investment team that in order to obtain a “Development Spread” of 240 bps. To do this we reduce the “Total Project” from $25,000,000 to $24,324,324.
Conclusion
In conclusion, the Development Spread metric plays a crucial role in evaluating the profit potential of real estate development projects. By considering the risk and return differentials, investors can make informed decisions and strive for optimal financial performance.
Frequently Asked Questions about Using Development Spread in Real Estate Analysis
What is Development Spread in real estate?
Development Spread measures the return premium earned from developing a property versus purchasing a stabilized one. It is calculated as:
Development Spread (bps) = (Yield-on-Cost – Market Cap Rate) x 10,000
Why is Development Spread important?
It quantifies how much additional return a developer earns for taking on the risks of construction, leasing, and entitlements compared to buying an existing stabilized asset. A higher spread suggests greater potential benefit.
How is Yield-on-Cost calculated in development analysis?
Yield-on-Cost = Stabilized Annual Net Operating Income ÷ Total Project Cost
In the article’s case study:
$1,800,000 ÷ $25,000,000 = 7.2%
What is a typical market cap rate and how is it used in this context?
A market cap rate represents the yield on a stabilized, comparable property. In the example, similar buildings had cap rates of 4.5% to 5.5%. A 5% cap rate was chosen for comparison.
How do you interpret a Development Spread of 220 bps?
It means the developer earns an extra 2.20% yield for taking on development risk versus buying a stabilized property. This additional return compensates for construction and leasing uncertainty.
What if a higher Development Spread is required by investors?
If investors require a 240 bps spread, inputs like land cost or construction budget can be adjusted using Excel’s “Goal Seek” tool to achieve that target spread while maintaining project feasibility.
What Excel tool helps adjust inputs to reach a target spread?
Use Goal Seek in Excel:
Go to Data > What-if Analysis > Goal Seek
Set the development spread cell to the desired value (e.g., 240 bps) and adjust a relevant input (e.g., total project cost) until the desired result is reached.
Is Development Spread sufficient for investment decisions?
No. While it’s a key indicator, it should be evaluated alongside metrics like IRR and Equity Multiple to gain a full picture of a project’s risk and return profile.

