Using Conditional Formatting in Real Estate Financial Modeling
Your real estate financial models are only as good as their ability to be used by others. Or in other words, if others can’t figure out how to use your model, it isn’t worth much! So when building real estate financial model templates, besides using Modeling Best Practices, I personally employ a variety of techniques to guide the user as they navigate the model and while inputting assumptions.
One such technique is to use Conditional Formatting in Excel.
Note: This topic originally came up in a lengthy forum thread in our real estate financial modeling Accelerator training program. I created a video response on how I use Conditional Formatting in construction cash flow forecasting, and this mini-tutorial was born.
I use a simple construction cash flow module to demonstrate this technique.
What is Conditional Formatting in Excel?
Every cell has some base formatting. At any time, you can manually change that formatting depending on the needs of your model. However, sometimes you may want the cell to have different formatting depending on what’s in that cell, or in another cell. That’s where Conditional Formatting comes in.
Conditional formatting is a tool available in Excel (and Google Sheets) where you can set the formatting for a given cell to change dynamically based on some logic statement you write.
So for instance, imagine you want to highlight all cells greater than a certain value. Conditional Formatting can do that for you. Or perhaps, you want to hide all columns beyond a certain date. Conditional Formatting can do that as well.
When to Use Conditional Formatting in Real Estate Financial Modeling?
When to use Conditional Formatting in your models really depends on what you’re doing. But there are certain instances when this comes up more often than not.
For instance, I use Conditional Formatting to change black font (i.e. calculation) cells to blue font (i.e. input) cells based on an action by the user. So in the case of floating rate vs. fixed rate debt, the user would toggle from Fixed to Floating, and a row of interest rate inputs would change to blue to signal to the user to change those monthly values.
Other circumstances where Conditional Formatting comes in handy including hiding (or graying out) unnecessary sections or cells, changing the number formatting dynamically, highlighting certain values of interest, or in the case of the tutorial below, guiding the user to enter values where they’re meant to be entered.
Video Tutorial – Using Conditional Formatting in Real Estate Financial Modeling
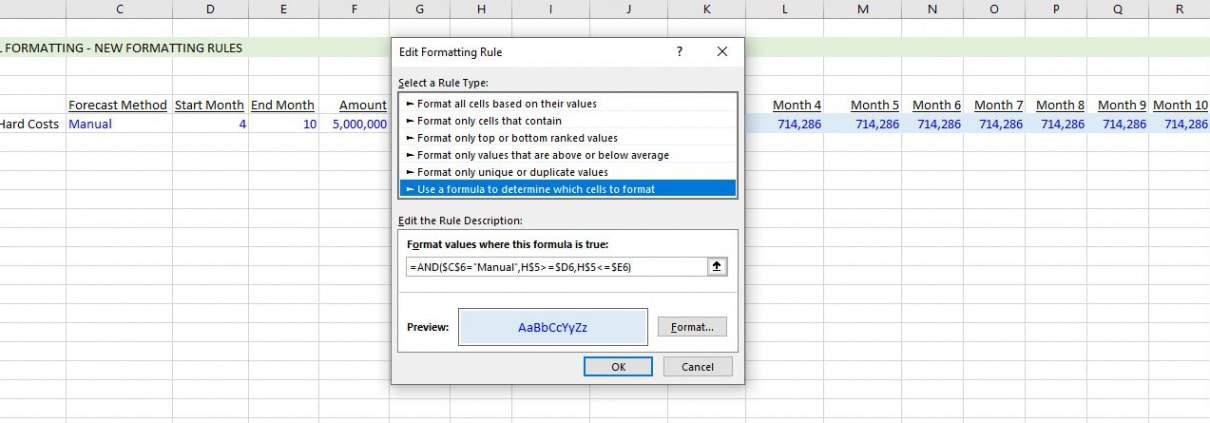
I recently received a question in our Accelerator Forums related to a Conditional Formatting rule I use in my Actual + Forecast Construction Draw Schedule with S-Curve. In that model, the user enters actual construction cash flows that have occurred to date, and then the model forecasts the remaining cash flows dynamically.
I added Conditional Formatting logic to that model, so as to guide the user to which months to enter actual cash flows. Or in other words, the months that are eligible for actual cash flows are visible while future months are grayed out. The logic is based on a date assumption entered by the user.
In answering the question, I created the following video and then thought this would be a nice companion to a blog post on the subject. So download the completed file from the tutorial below and then watch the video.
- Click here to download the file created in this video tutorial
Frequently Asked Questions about Using Conditional Formatting in Real Estate Financial Modeling
What is conditional formatting in Excel?
Conditional formatting is a tool in Excel (and Google Sheets) that changes a cell’s formatting—such as font color, fill color, or number format—based on a logic statement or condition you define.
Why is conditional formatting useful in real estate financial models?
Conditional formatting improves usability by guiding users through the model. It visually distinguishes inputs from outputs, highlights important assumptions or results, and hides irrelevant data depending on user inputs or timeline.
How does Spencer use conditional formatting to identify input cells?
He uses it to toggle between black font (for calculation cells) and blue font (for input cells). For instance, if a user switches from Fixed to Floating rate debt, the interest rate input row dynamically changes to blue to prompt user input.
Can conditional formatting be used to gray out future months in a construction forecast?
Yes. Spencer uses conditional formatting to gray out future months based on a date assumption, so that only months eligible for actual cash flow inputs remain active and visible.
What are some common uses of conditional formatting in real estate models?
Common uses include: flagging input cells, hiding or graying out unnecessary sections, dynamically changing number formats, and emphasizing key outputs or error states based on model logic.
Where can I find an example model using these techniques?
You can download the actual Excel file demonstrated in Spencer’s tutorial directly from the blog post. The model features a construction cash flow schedule with conditional formatting based on a user-defined date.
What is the benefit of using conditional formatting instead of hard-coded formatting?
Conditional formatting responds dynamically to user inputs or changes in assumptions, helping make models more interactive, self-explanatory, and error-resistant—especially for users unfamiliar with the backend logic.
Is conditional formatting supported in Google Sheets as well?
Yes, Google Sheets offers conditional formatting with similar logic-based rules, though with more limited styling options compared to Excel.


