Actual + Forecast Construction Draw Schedule with S-Curve (Updated Dec 2023)
Several times in the last month, I’ve been asked to tackle an interesting real estate financial modeling challenge – pare actual construction draw cash flows with s-curve cash flow forecasts to create an Actuals + Forecast Construction Draw schedule.
The real challenge in this exercise, is to have the actual construction draws transition into the s-curve cash flow forecasts such that the s-curve forecast continues from the point where the actuals end. So I decided to spend some time this weekend taking on this challenge. This blog post, together with the accompanying video tutorial and Excel Workbook, are the results of that effort.
Interested in developing the skills to create custom real estate modules on your own? Check out our real estate financial modeling Accelerator.

Let’s combine actual construction cash flows with s-curve and straight-line forecasted cash flows. What else is a guy to do for fun on the weekend!?
Methodology Behind the Model – Getting to a Revised S-Curve
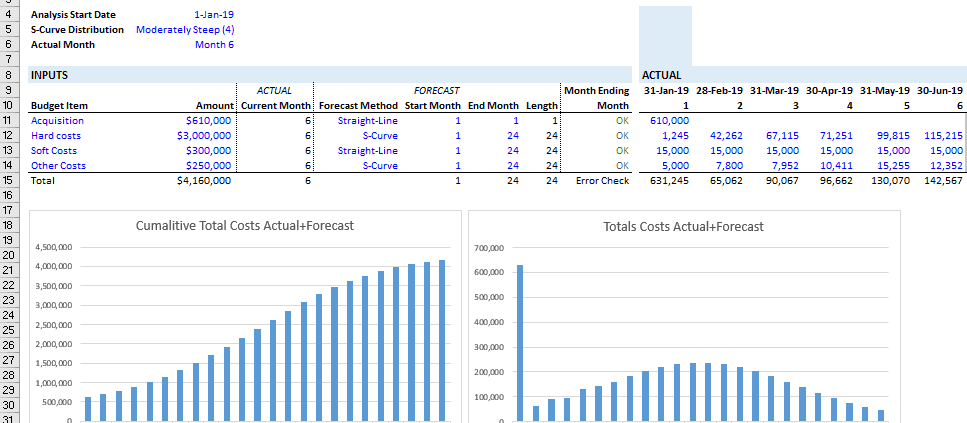
The model is separated into six sections. The first three sections are color coded blue and contain the inputs and main outputs of the model. The sections are labeled ‘Inputs’, ‘Actual’, and ‘Actual+Forecast’. In most cases, these are the only three sections you’ll look at.
Reminder: Blue font cells are required inputs, black font cells are calculations and outputs. Only edit blue font cells.
- The Inputs section contains the construction line items (e.g. land costs, hard costs, etc), budget amounts, forecast method (e.g. straight-line vs. s-curve), and cash flow timing (start month vs end month).
- The Actual section is where you enter actual cash flows. Enter the Actual Month as of today in cell C6, and then fill out the Actuals section with the monthly actual cash flows by line item through to today.
- With the Input and Actual sections complete, the Actual+Forecast section shows the combination of Actual cash flows through the current month, together with the cash flow forecasts thereafter through to the end of the construction period. Months considered actual are labeled with an ‘A’ in row 8 of the Actual+Forecast section while months considered a forecast are labeled with an ‘E’.
The last three sections are color coded grey, and contain the s-curve logic. They are hidden by default, but are grouped such that to reveal the sections simply click the plus sign at the top of column BQ. These sections are labeled ‘Initial S-Curve Ratios’, ‘Revised S-Curve Ratios’, and ‘Forecast S-Curve’.
- The Initial S-Curve Ratios section calculates the s-curve as a percentage per month, with no actual cash flows figured in.
- The Revised S-Curve Ratios section takes into account the actual cash flows, but does not adjust the s-curve as a percentage by the actual amount spent.
- The Forecast S-Curve adjusts the percentage per month to account for the actual cash flows, and then calculates the new s-curve forecast. These cash flows are then linked back to the ‘Actual+Forecast’ section to properly blend the actual cash flows with the newly revised s-curve forecast.
The trick in the revised s-curve calculation was to account for the variance in initial forecast cash flow versus actual cash flow and then adjust the remaining s-curve forecast to account for the remaining budget. This was done using ‘Remaining Ratio’ and ‘S-Curve Multiple’ concepts, combined with the Revised S-Curve Ratios (i.e. Initial S-Curve Ratios less actual periods).
The result is, a combined Actuals + Forecast draw schedule that blends what has been spent to date with a revised forecast for what is left to be spent.
Sections 1 and 2, Inputs and Actual, contain all inputs for the model.
Using this Actuals + Forecast Construction Draw Schedule in Your Model
First, download the model (link below) and then open up the Workbook. Keep in mind, the Excel Workbook is a module that you would plugin to your existing development model. It is not standalone.
You’ll notice right off the bat when you open the Workbook, that I’ve only include four line items. However, the calculations for each line item are made in the same row on the Budget tab. So to add items is easy. Simply insert a new row between either rows 11 and 12, 12 and 13, or 13 and 14, and copy the complete row from above down.
Then, link the Total row under the ‘Actual+Forecast’ section (row 15) to your DCF as that is the amount spent (actual+forecast) to develop the property (e.g. the negative cash flow in your net unlevered cash flow line).
The Actual + Forecast Construction Draw Schedule – Video Tutorial
To compliment the above, I’ve created a short video demonstrating the methodology behind the model and how you might implement it into your own development model.
How to Add More Periods to the Model – Video Tutorial
The module comes with 24 monthly periods by default, but your situation may call for more periods. In this short video, I show you how to additional periods.
How to Insert Additional Budget Line Items into the Model – Video Tutorial
The module comes with nine budget line items across three sections: land costs, hard costs, and soft costs. In this short video, I show you how to quickly insert additional budget line items.
Download the Actual + Forecast Construction Draw Schedule with S-Curve
To make this model accessible to everyone, it is offered on a “Pay What You’re Able” basis with no minimum (download for free if you need) or maximum (your support helps keep the content coming – similar institutional-quality real estate modules sell for $100 – $300+ per license). Just enter a price together with an email address to send the download link to, and then click ‘Continue’. If you have any questions about our “Pay What You’re Able” program or why we offer our models on this basis, please reach out to either Mike or Spencer.
We regularly update the model (see version notes). Paid contributors to the model receive a new download link via email each time the model is updated.
Frequently Asked Questions about Actual + Forecast Construction Draw Schedule with S-Curve
Version Notes
Version 1.3
- Added logic to allow budget line items to be set to 0 without causing the model to error out
Version 1.21
- Added logic to allow budget line items to be set to 0 without causing the model to error out
Version 1.2
- Expanded budget categories to include separate sections for ‘Land Costs’, ‘Hard Costs’, and ‘Soft Costs’
- Added additional budget line items
- Added a time 0 timing; updated logic to allow for time zero
- Changed Period Timing labels to Month, Quarter, and Year
- Fixed issue where S-Curve was not working with Quarterly and Annual periods
- Updated Conditional Formatting rules for ‘Actual’ section
- Misc. formatting enhancements
Version 1.1
- Updated versions tab
- Removed reference to $USD to make module more applicable to international users
- Made header logic independent in each section to make it easier to manually add columns
- Added option to use quarterly and annual periods
- Misc. formatting and layout enhancements
Version 1.01
- Fixed an issue where ‘Conditional Formatting’ wasn’t working properly
- Improved logic for header
Version 1.0
- Initial release