How to Use the Construction Draw and Interest Calculation Model
As promised, I’ve recorded a tutorial on how to use my construction draw and interest calculation model. The 20 minute tutorial walks you through how to use the model to forecast construction cash flows during your development period. The model calculates construction loan interest, forecasts the distribution of sources and uses throughout construction, projects an equity and debt draw schedule, and visualizes the outcomes in two column graphs and a pie chart.
Note: Since recording this tutorial, I’ve updated the model several times. The latest version includes features that differ from the version used in the tutorial. While the tutorial is still largely applicable, note below the important differences between the version used in the video and the most recent version of the model.

A Few Things to Keep In Mind about this Model
Because I chose not to use iterative calculation when figuring loan interest, in this tutorial I show you instead how to use Goal Seek with the model to size your construction loan. The Goal Seek method allows you to properly calculate the total equity and debt required; which in turn calculates an interest reserve for the construction period.
While this method is not fully dynamic, I believe it is preferable to dealing with a circular reference when calculating construction interest.
Also important to note, the model only calculates development period cash flows. It does not model operating cash flows or partnership-level cash flows. With that said, the model can easily be integrated with your DCF and waterfall to create a pretty comprehensive development model.
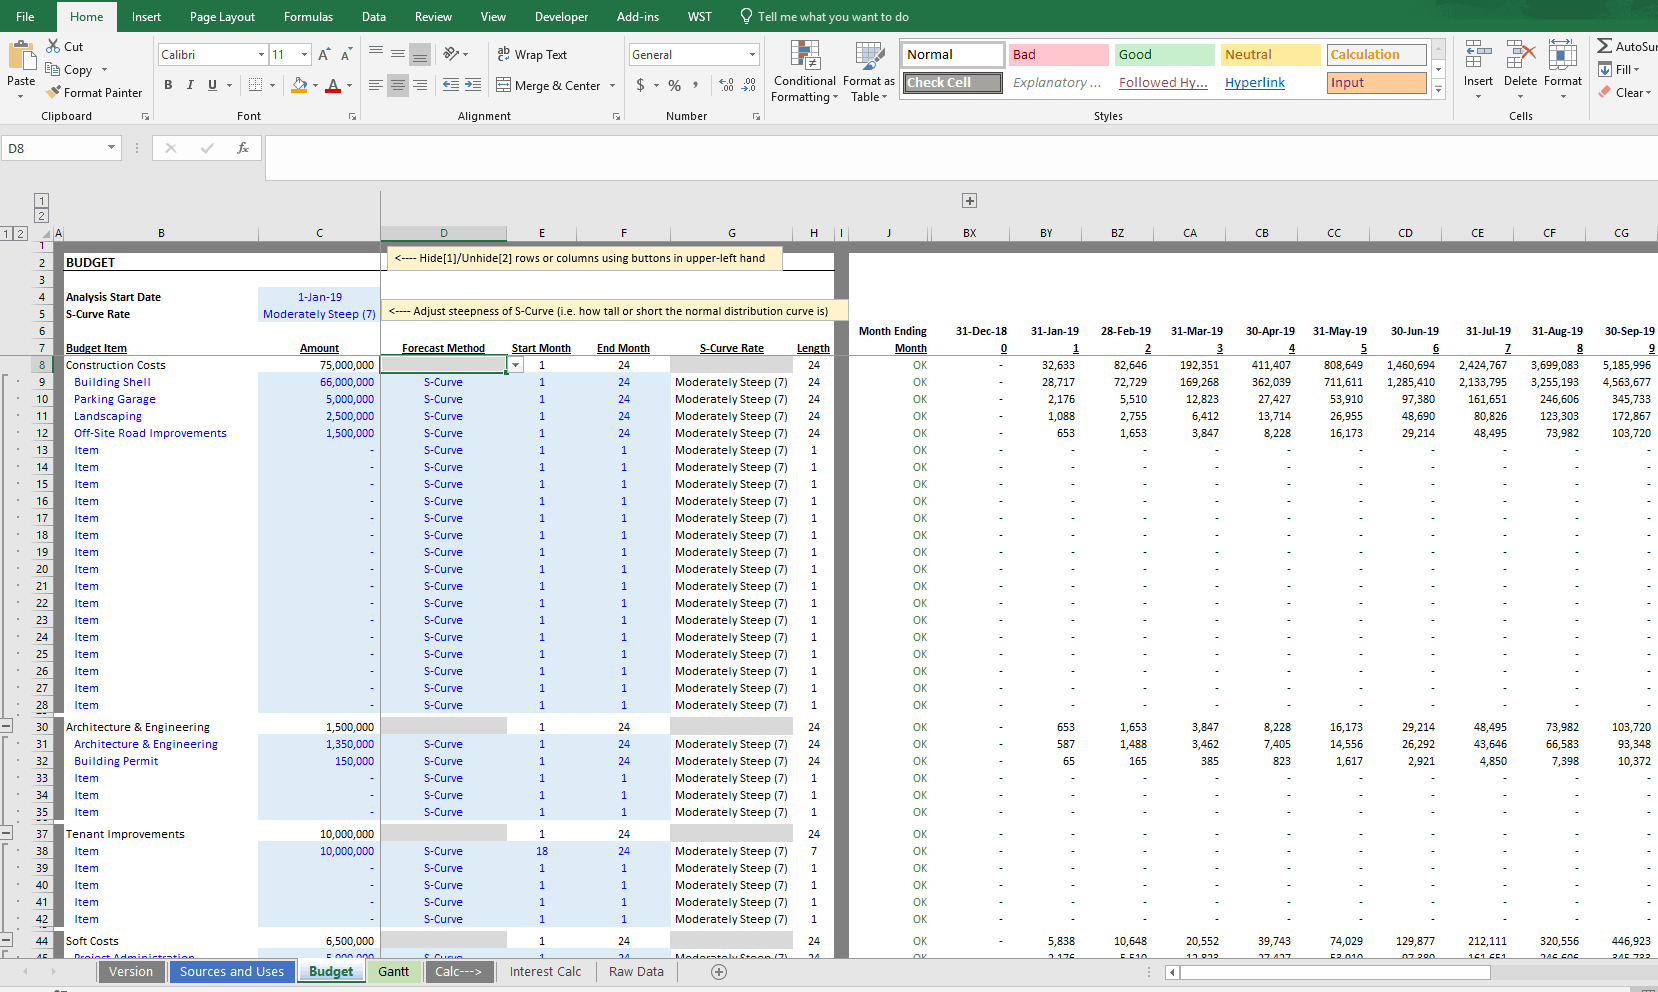
For budget item timing purposes, the user no longer enters a ‘Length’ assumption. Instead, the user enters the 1st and last month.
Important Changes to the Model Since Recording this Tutorial
While the core aspects of the model have largely stayed the same, you’ll notice some key differences between the version of the model used in the video below, and the version you’ve likely downloaded. Here are a few things to keep your eye out for:
- Most importantly, since recording this video I’ve gone away from the “Length” input on the Budget tab and instead have gone to 1st month and last month inputs. In other words, rather than entering the first month that a budget item begins to fund, followed by the length (in months) that the budget item will fund, instead the user enters the first month that a budget item begins to fund and the last month the budget item funds. The Length is then automatically calculated. This makes modeling your construction draw much easier.
- You’ll now find the sources and uses cash flows detailed out on the Sources and Uses tab, immediately to the right of the graphs.
- I’ve since added a Gantt chart tab, where the construction schedule is dynamically (i.e. automatically) visualized
- The error check system is far more comprehensive and dynamic now. If your sources don’t match your uses, or your draw schedule length does not match your construction period, the model will clearly alert you.
Frequently Asked Questions about the Construction Draw and Interest Calculation Model
What is the purpose of the Construction Draw and Interest Calculation Model?
The model is designed to forecast construction-period cash flows, calculate construction loan interest, project equity and debt draw schedules, and visualize these outcomes through column and pie charts.
How is loan interest calculated without creating circular references?
Instead of using iterative calculations, the model uses Excel’s Goal Seek feature to size the construction loan. This avoids circular references while still achieving accurate interest reserve and funding calculations.
Does the model account for operating or partnership-level cash flows?
No, the model is limited to development-period cash flows. However, it can be integrated with a DCF and waterfall model for a more comprehensive financial analysis.
What has changed in the latest version compared to the tutorial video?
Several updates include:
Replacing the “Length” input with “1st month” and “last month” inputs for budget item timing
A new Gantt chart tab that visualizes the schedule dynamically
Detailed sources and uses now shown on a dedicated tab
An improved error check system that highlights mismatches or inconsistencies
How do I enter timing for a budget item in the latest model version?
Users now enter the “1st month” and “last month” for each budget item instead of a “length” input. The model then calculates the duration automatically.
Where are sources and uses displayed in the model?
They are displayed on the “Sources and Uses” tab, located immediately to the right of the visual graphs in the Excel workbook.
What visual tools are included in the model?
The model includes two column graphs, a pie chart, and a dynamic Gantt chart to visually represent the draw schedule and budget timeline.
What Excel versions is the model compatible with?
The model is compatible with Excel 2013, Excel 2016, and Excel 365.
How can I get the latest version of the model?
The model is available on a “Pay What You’re Able” basis via the A.CRE website. Enter any amount (including $0), provide an email, and click ‘Continue’ to receive the download link.