Construction Draw and Interest Calculation Model (Updated Feb 2024)
I originally uploaded this equity/construction loan draw and interest calculation tool to our library of real estate financial analysis models in 2016. Over the years, I’ve continued to update it as suggestions, comments, and requests flowed in from our readers.
The model is meant to be used to forecast construction budget cash flows (uses), and then model the capital required to pay for those construction cash flows (sources). In doing so, the model also dynamically calculates the construction interest and estimates the equity required to complete the project.
Note: Since uploading this model several years ago, numerous updates have been made. See the version notes at the end of this post for more details.
What’s New in the Construction Draw and Interest Calculation Model
You’ll find that since the first iteration of the model was released in 2016, the model has changed dramatically. Over the last few years, I’ve added s-curve forecasting capability, cleaned up various errors, added more budget line items and made it easier to add more, included three graphs to illustrate how the sources and uses flow, built a dynamic (i.e. automatic) Gantt chart to better visualize the construction schedule, added a detailed monthly accounting of the sources vs uses, among other changes.
This model continues to improve thanks to your feedback. So if you spot an error or have a recommendation for how to improve the model, please let me know.
Using the Construction Draw and Interest Calculation Model
The model includes seven tabs – a Version tab, Sources and Uses tab, Budget tab, Gantt tab, Calc–> section separation tab, Interest Calc tab, and Raw Data tab. I’ll briefly discuss each tab below. You can also check out a basic video tutorial I recorded showing how to use the model.
Check out the basic video tutorial I recorded for this model
Reminder about A.CRE formatting convention: Blue font means a required input cell while black font means an output cell. Green and red fonts are used in error checking.
Version tab. The version tab is where changes to the model are tracked, as well as where you can find salient links related to the model.
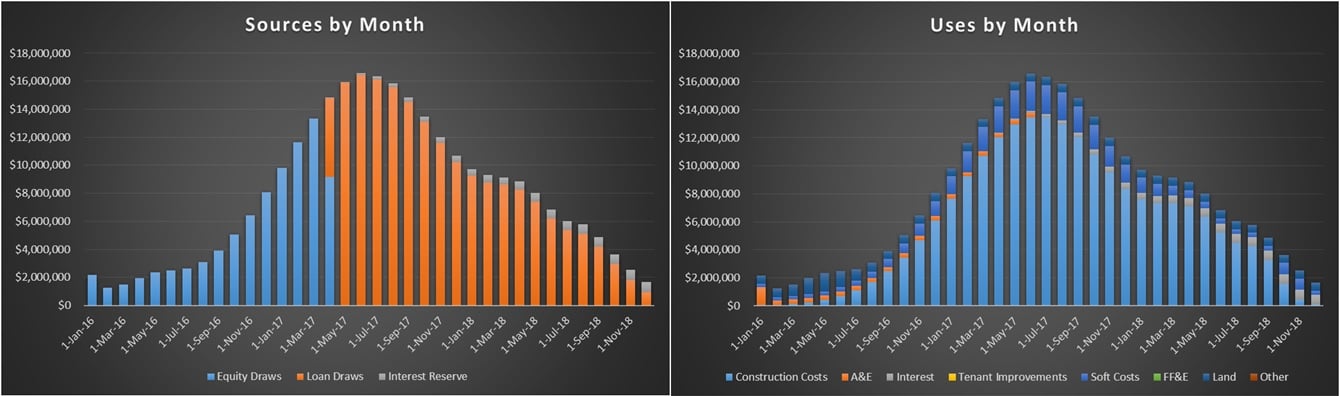
Sources and Uses tab. The Sources and Uses tab contains four inputs, a summary of the Sources and Uses, and three charts together with a monthly detail of the Sources and Uses cash flows.
The least intuitive aspect of this tab, is the construction loan sizing mechanism. Because construction interest calculation involves circular logic (interest charged on top of interest) and because the model does not use Excel’s iterative calc feature, you’ll need to use a manual iterative process to solve for your desired loan-to-cost (LTC). To do this, change the value in cell E6 or use Excel’s Goal Seek to change the value in cell E6 until the actual LTC (cell D6) matches your desired LTC.
Also worth pointing out is that the Column charts found on this tab use dynamic named ranges, another topic I wrote about a while back, to make the charts dynamic to changes in construction length.
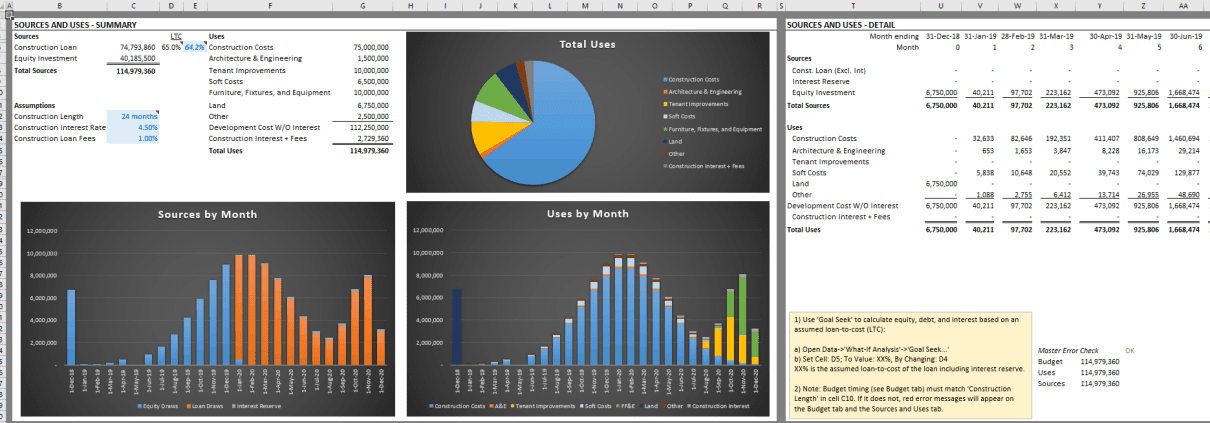
View the project’s sources and uses by month
Budget tab. The meat of your modeling (forecasting) occurs in the Budget tab. It is here where you set your construction budget (column C), and then forecast how those budgeted funds are allocated per month. Forecasting involves selecting a forecast method, either S-Curve, Straight-Line, or Manual Input and is selected in column D. Once you’ve selected a forecast method, you will enter what month the cash flow for a given budget item will begin (column E) and when that cash flow will end (column F).
The results of your inputs as entered on the left-hand side of the worksheet, are shown in the monthly cash flows on the right-hand side of the worksheet. In the event a budget line item is set to be forecasted via Manual Input, click the ‘Plus’ sign above column BX to unhide the Manual Input columns.
Gantt tab. Based on your budget items and timing assumptions on the Budget tab, a Gantt chart on the Gantt tab will automatically update so as to visualize your construction schedule.
Calc—> tab. This is a section separation tab only. It has no other purpose.
Interest Calc and Raw Data tabs. The Interest Calc and Raw Data tabs perform backend calculations and house information for data validation lists. In addition to calculating construction interest, the Interest Calc tab also models the equity and debt cash flows.

Excel Compatibility
This model is compatible with Excel 2013, 2016, and 365. While it has not been tested on older versions of Excel, it does not contain VBA and so will likely work with earlier versions of Excel.
Download the Construction Draw and Interest Calculation Model
To make this model accessible to everyone, it is offered on a “Pay What You’re Able” basis with no minimum (enter $0 if you’d like) or maximum (your support helps keep the content coming – typical real estate Excel models sell for $100 – $300+ per license). Just enter a price together with an email address to send the download link to, and then click ‘Continue’. If you have any questions about our “Pay What You’re Able” program or why we offer our models on this basis, please reach out to either Mike or Spencer.
We regularly update the model (see version notes). Paid contributors to the model receive a new download link via email each time the model is updated.
Frequently Asked Questions about the Construction Draw and Interest Calculation Model
Version Notes
v3.75
- Misc. formatting improvements
- Misc. updates to placeholder values
- Updated links on Versions tab
v3.74
- Updated Construction Interest calculation methodology to charge interest on previously accrued interest (row 25 ‘Interest Calc’)
- Misc. updates to placeholder values
v3.73
- Updates to Budget tab
- Fixed issue with Conditional Formatting when line item uses Manual Input and line item started later than period 1
- Moved dynamic note for using the Manual Input feature to column BX
- Added in-cell labels for ‘Month’ to date header
- Misc. updates to placeholder values
v3.72
- Cleanup to Conditional Formatting to fix issues with Manual Input shown cells as well as remove unnecessary Conditional Formatting rules
- Added note to Budget worksheet cell H3 to provide instructions for finding Manual Input cells
v3.71
- Minor fix to instructions on Sources and Uses tab for using Goal Seek to solve for LTC
v3.7
- Update to placeholder values to improve user experience
v3.6
- Added ‘Fees Timing’ input on Sources and Uses tab
- Relabeled cells B72 and B75 on Budget tab to ‘Total Budget before Financing’ and ‘Total Budget after Financing’ respectively
v3.5
- Added option to model loan fees either at closing, or as loan funds are drawn
- Added Loan Fees line to Budget tab
- Updated Construction Interest line on Budget tab to only include construction interest
- Misc. formatting enhancements and updates to placeholder inputs
v3.4
- Fixed issue Gantt chart was no longer linked correctly to Budget tab
- Added time zero to Gantt chart
v3.3
- Fixed issue where FF&E line item was hidden on Sources and uses tab
- Fixed error where Sources total was capturing duplicate Sources line items
- Moved ‘Const. Loan (Excl. Int.)’ and ‘Interest Reserve’ totals beneath ‘Construction Loan’ source
- Misc. formatting updates to Sources and Uses tab
v3.2
- Fixed issue where month 5 on the Interest Calc tab had been removed from analysis.
- Updated Sources and Uses – Detail due to the month 5 fix implemented on the Budget tab
v3.1
- Updated Version tab
- Added “Month” label to header on Sources and Uses tab
- Fixed issue where the SUM() formulas for the Sources error check (Y36) and Uses error check (Y37) were reversed
- Changed ‘Analysis Start Date’ formatting to mmm-yyyy to make clear that periods end on the last day of the month
- Minor updates to headings for improved clarity
- Misc. formatting improvements and fixes
v3.0
- Added month 0, to allow for land to be purchased in time 0 before beginning of analysis
- Changed timing logic, such that user now enters 1st and last draw months, rather than draw length
- Cleaned up (shortened) S-Curve formula
- Removed $ throughout, to accommodate non-USD users
- Various formatting improvements
- Added a detailed Sources and Uses, by month, on the Sources and Uses tab
- Created a “Master Error Check” on the Sources and Uses table
V2.2
- Moved S-Curve calculations to columns EG:GV of the Budget tab to make it easier to add/delete budget rows
V2.0
- Added a Gantt chart tab
- Linked budget items to Gantt chart to automatically visualize the construction timeline
V1.31
- Added calculation for construction loan fees (origination fee, points, etc)
- Made color scheme consistent across charts
V1.2
- Added budget timing alerts
- Included a fix in how Length was calculated in column F of the Budget tab.
- Fine-tuned the error check to eliminate a few false error alerts that were occurring


