Create a Dynamic Real Estate Chart in Excel
Most of the real estate financial models we’ve shared over the years are dynamic to analysis period. Meaning, we’ve included an input to adjust the length of the analysis period, and the model will adjust the results accordingly.
This is a helpful feature to sensitive returns relative to exit, but presents some complications from a technical modeling standpoint. One of these complications is, what happens to charts or graphs you’ve created when the analysis length changes. In this tutorial, I’ll show you how to make your charts or graphs in Excel dynamic to inputs such as hold period.
Examples of Dynamic Charts in Real Estate Models
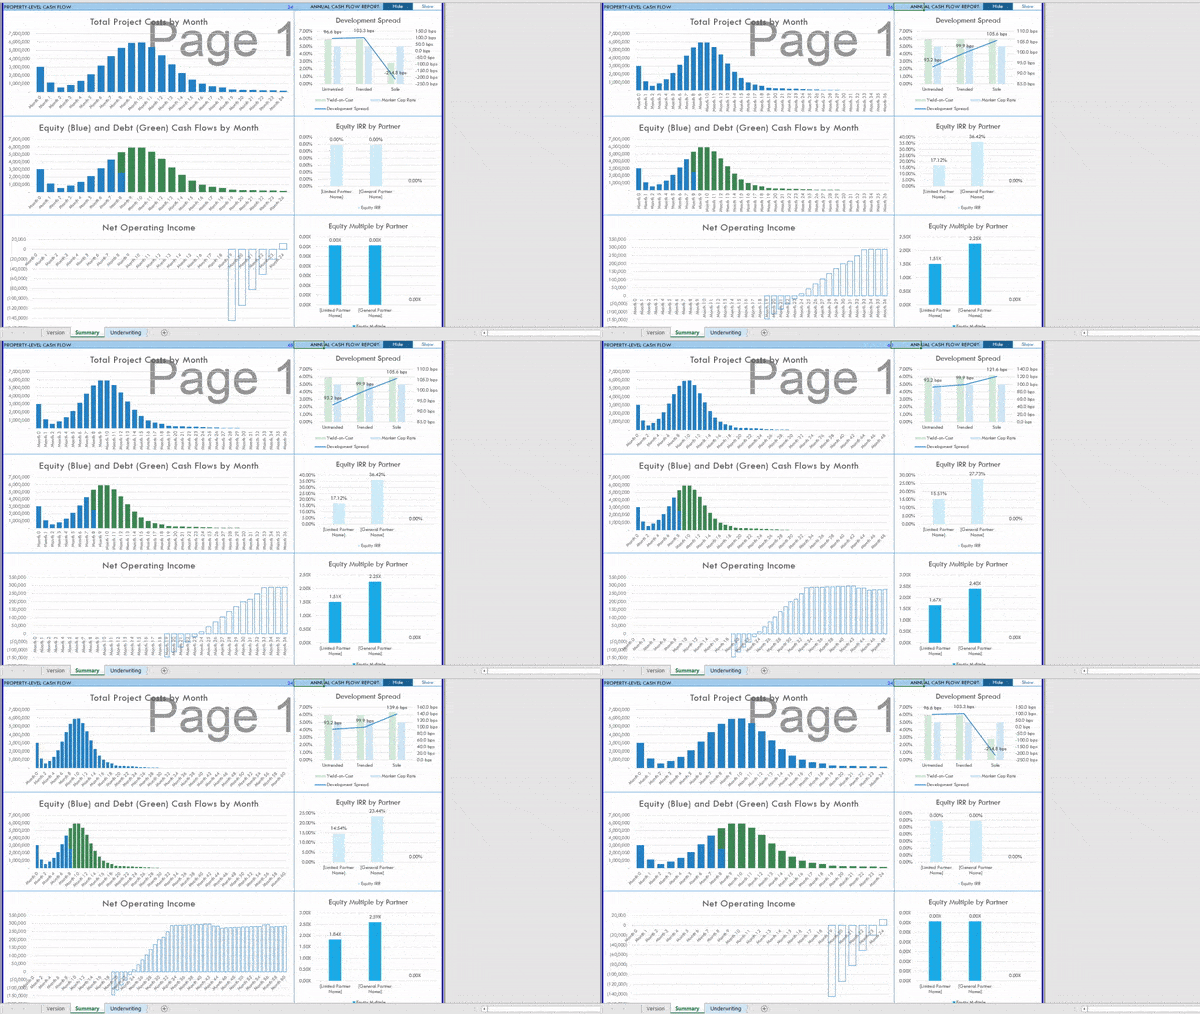
I typically build my models to be fully dynamic to changes in the analysis period (i.e. hold period). This functionality, though, means that charts that are set for a specific hold period (say 10 years) do not work correctly when the hold period changes. To remedy this issue, I create dynamic charts using named ranges and the OFFSET() function, which automatically adjust the data they display as the analysis period input changes.
I have quite a few examples of this in our Library of Real Estate Excel models. Of particular note are the three charts used in the Summary tab of my Apartment Development Model (see GIF above). I also have included dynamic sources and uses charts in both my All-in-One model and my Construction Draw and Interest Calculation Module.
And if you’re a member of our A.CRE Real Estate Financial Modeling training program, you’ll find a dynamic chart in course ‘9. Building an Acquisitions Model from Scratch’. While the model we build together in that course isn’t entirely dynamic to hold period, I created the chart on the Summary tab to be dynamic to analysis period.
How it Works – Using Dynamic Named Ranges in Excel Charts
I’ll let the video provide more detailed step-by-step instructions, but to summarize the process.
- I first create a dynamic named range for the data I want to display. This involves using the OFFSET function and the Name Manager (if you recall, I did a similar post a few years back on creating dynamic lists using named ranges together with data validation).
- I then drop in a chart, such as a column chart, into my workbook.
- Next, I go into chart tools and change the data source to the named ranges I just created.
- The end result, is a chart that dynamically re-formats/redisplays the information as the data/inputs change.
Video Tutorial – Dynamic Charts in Excel – Real Estate Edition
In the following video, I walk you through the process of creating dynamic charts in Excel for real estate financial modeling.
Quirk with this Method
I’ve found one issue with this method. If there is an error in any of the cells within the named ranges, Excel displays an annoying alert each time the named ranges update; I first discovered this issue while creating my All-in-One Model.
The solution I came up with, is to include an IFERROR function in each of the cells that instructs the cell to be empty {=IFERROR(FORMULA,””)} if the formula it is calculating has an error.
I’m sure there are other ways of building dynamic charts or tackling the named range error. If you have one, I’d love to see or hear about it. And as always, feel free to reach out with any questions, comments, or requests you may.
Frequently Asked Questions about Creating Dynamic Real Estate Charts in Excel
What is a dynamic chart in Excel for real estate modeling?
A dynamic chart in Excel adjusts automatically based on inputs such as the analysis or hold period. It updates the displayed data and structure without needing manual reconfiguration when those inputs change.
Why are dynamic charts useful in real estate models?
Dynamic charts ensure visual data outputs remain accurate even when users change inputs like the hold period. This is especially helpful when analyzing different investment timelines or running sensitivity scenarios.
How do you create a dynamic chart in Excel?
The process involves:
Creating a dynamic named range using the OFFSET() function.
Inserting a chart (e.g., column chart).
Updating the chart’s data source to the named range via the Select Data dialog.
The chart will then respond to changes in the input range size.
What Excel function is used to build dynamic named ranges?
The OFFSET() function is used to define dynamic named ranges that grow or shrink based on inputs like the analysis period.
Where can I see examples of dynamic charts in action?
Examples are found in:
The Summary tab of the Apartment Development Model
The All-in-One Model
The Construction Draw and Interest Calculation Module
Course 9 of the A.CRE Financial Modeling program
What issue might arise when using this method?
If any cell in the named range contains an error, Excel may show an alert each time the range updates. This can be disruptive when using the chart.
How can I prevent errors from affecting dynamic charts?
Wrap your formulas in an IFERROR() function like this: =IFERROR(FORMULA,””). This ensures that any errors return a blank instead of disrupting the chart update.
Can I use this technique in any Excel version?
This method works in Excel 2013, Excel 2016, and Excel 365, as noted in the tutorial context and related models.


