3-Tiered Acquisition Debt Module (Updated Apr 2026)
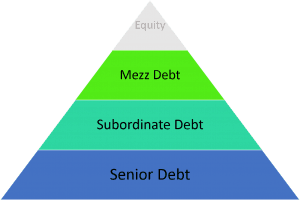
This is a 3-tiered debt module that will allow the user to add one to three tiers of debt to his or her real estate DCF model. Includes the option to layer in senior debt, secondary debt, and mezzanine debt; calculate interest on either a 30/360, actual/360, or actual/365 basis; and model additional proceeds (i.e. earn-out or good news funding) later in the loan term.
This Excel file should be fairly intuitive and easy to understand and the entire model is on one sheet. You can find a link to download the model below. Read the tutorial and watch the video at the bottom of this post to learn how to use the model.
Download the 3-Tiered Debt Module
To make this model accessible to everyone, it is offered on a “Pay What You’re Able” basis with no minimum (enter $0 if you’d like) or maximum (your support helps keep the content coming – typical real estate Excel models sell for $100 – $300+ per license). Just enter a price together with an email address to send the download link to, and then click ‘Continue’. If you have any questions about our “Pay What You’re Able” program or why we offer our models on this basis, please reach out to either Mike or Spencer.
3-Tiered Debt Module – Highlights and Important Notes
The Inputs Section
The top of the sheet, from rows 8 to 35, contains almost all the inputs for the model. In cells D9 and D10, the user should link the acquisition price and date from his or her model. Rows 12-35 contain all the manual input cells for the debt calculations as well as some essential return summary numbers for all three tiers of debt. Additionally, there is a box on the far right that summarizes combined loan details such as a total dollar amount of leverage and a weighted average cost of the debt combined. The weighted average cost of debt is an approximation of the weighted average over the hold period and fails to account for additional capital drawn during the hold period as well as if the durations of the loans are different.
Safety Mechanisms
There are two safety and warning measures put into the model that warn you if you have input a loan term that is longer than the interest only period plus the amortization period. If you try to input a number in the term input cell that is greater than the amortization and interest only period, a popup will appear telling you the input is too large, if you change the input cells in either the amortization period input cell or the interest only period input cell and combined they are less than the term, both the cells will turn red. If this happens, be sure to alter the appropriate cells to mitigate the issue.
Selecting the Lender’s Interest Calcs
In row 24, for the three loans, you will see ‘Loan Type’. Here you can select between 30/360, 365/360, and 365/365. These are three common methods that lenders use to calculate interest, they all effect a borrower’s actual interest rate and if you’d like to understand more about how these methods are calculated, check out my blog post on this topic by clicking here.
To see how this model works by choosing between each loan method, scroll down to row 46. Below are the Chosen Loan Amortization Schedules for each loan. First, move your mouse or click around the cells to see the formula used. Next, scroll to row 114 and there you will notice three boxes with plus (+) signs in the far left hand side of your screen (between row 114 – 192), click to open the amortization schedules. These are the amortization tables that are chosen from in the Chosen Loan Amortization Schedules.
Funding Cap Ex
Rows 31 through 35 will allow you to input the details for additional funding for capital improvements. Simply answer ‘Yes’ to the ‘Funding Cap Ex?’ question and the cells below will open up. The newly opened up cells will ask you what percent of cap ex would you like to fund with the loan.
It is critical to note that you must input the capital expenses from your own model into this module in order for this to work. To do this, scroll down to row 235 and in the far left corner of the screen you will see a box with a plus (+) sign in it. Click to open. In rows 199-201, link from your own DCF model your capital expenses. To illustrate how to do this, I included a second sheet in the excel file titled ‘CapEx’ with a capital expense portion of a DCF model to use as an example.
Below the cap ex inputs, starting in row 203, are the cap ex draws schedules according to your inputs. These draw schedules are used in the amortization schedules to reamortize the loans.
Inserting Debt Payments Into Your DCF Model
Take the cash flows in rows 39-44 and simply insert them into the debt section of your model. Be sure to match up the dates in row 35 with the dates in your model.
3-Tiered Debt Module – Video Tutorial
3-Tiered Debt Module – Conclusion
As always, I hope you find some value in this model and feel free to reach out with any questions, comments, or concerns.
Frequently Asked Questions about the 3-Tiered Acquisition Debt Module
Version Notes
v1.1
- CapEx tab: color-coded manual input cells (Tenant Improvements, Leasing Commissions, Other CapEx)
- Updated placeholder values
v1.0
- Initial Release


