Development Draw Schedule – Visually Customize Each Line Item (UPDATED APR 2022)
Working a lot with development draw schedules, I have always been looking for a catch all solution as to how one could easily model all the unique ways cash actually flows over time during the process. The norm for many is to model cash flows using a straight line method with even payments over time, or, as Spencer and I have outlined and shared on the site, others will incorporate a bell curve method such that costs gradually increase over time until the midpoint and then decrease back down towards the end. However, there are many unique cash outflows during every development project to which these methods don’t quite fit.
You might also find valuable our Construction Draw Schedule: Accounting for True LTC post or our Construction Draw and Interest Calculation Module post.
For example, an architect’s budget is usually much higher at the beginning of the development process in the design phase and will usually taper off and decrease significantly during the construction phase. If we think of the architect’s cash flows as shapes or lines over time, it may look like a bell curve in the beginning months starting at a relatively high dollar amount, but when construction starts, that dollar amount per month may drop significantly and be a straight line thereafter.
There is no real one size fits all formula that I have come across that can account for the uniqueness of various cash outflows and that can be used easily from model to model. However, the construction draw template attached is designed to do just that. This construction draw schedule is designed to give you an easy and visual way to ‘design’ your cash flows without having to come up with unique or complicated formulas for every individually unique item.
How the Development Draw Schedule Works
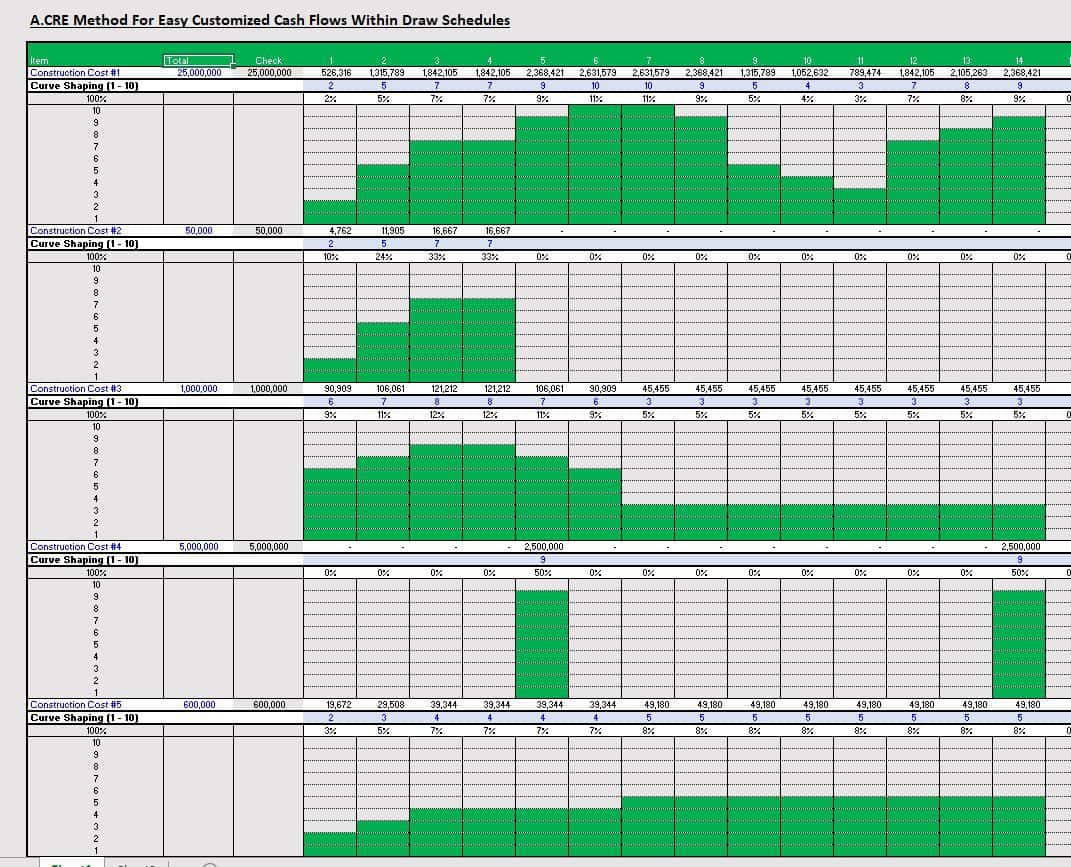
For each line item, there is a grouped set of rows underneath. In the row directly beneath the individual line item’s cash flow, the user will enter a number between 1 and 10 in each period. The series of 10 cells within the column below will turn green in accordance to the number input. For example, if the user inputs a three, the bottom three cells will turn green. If the user puts a 10, all ten cells in the column will turn green. The user will input numbers between 1 and 10 in each period and can visually see how the cash will outflow over the time period. See below for images of the model.
Model the Development Cash Flows with Sublines Open
Model the Development Cash Flows with Sublines Closed
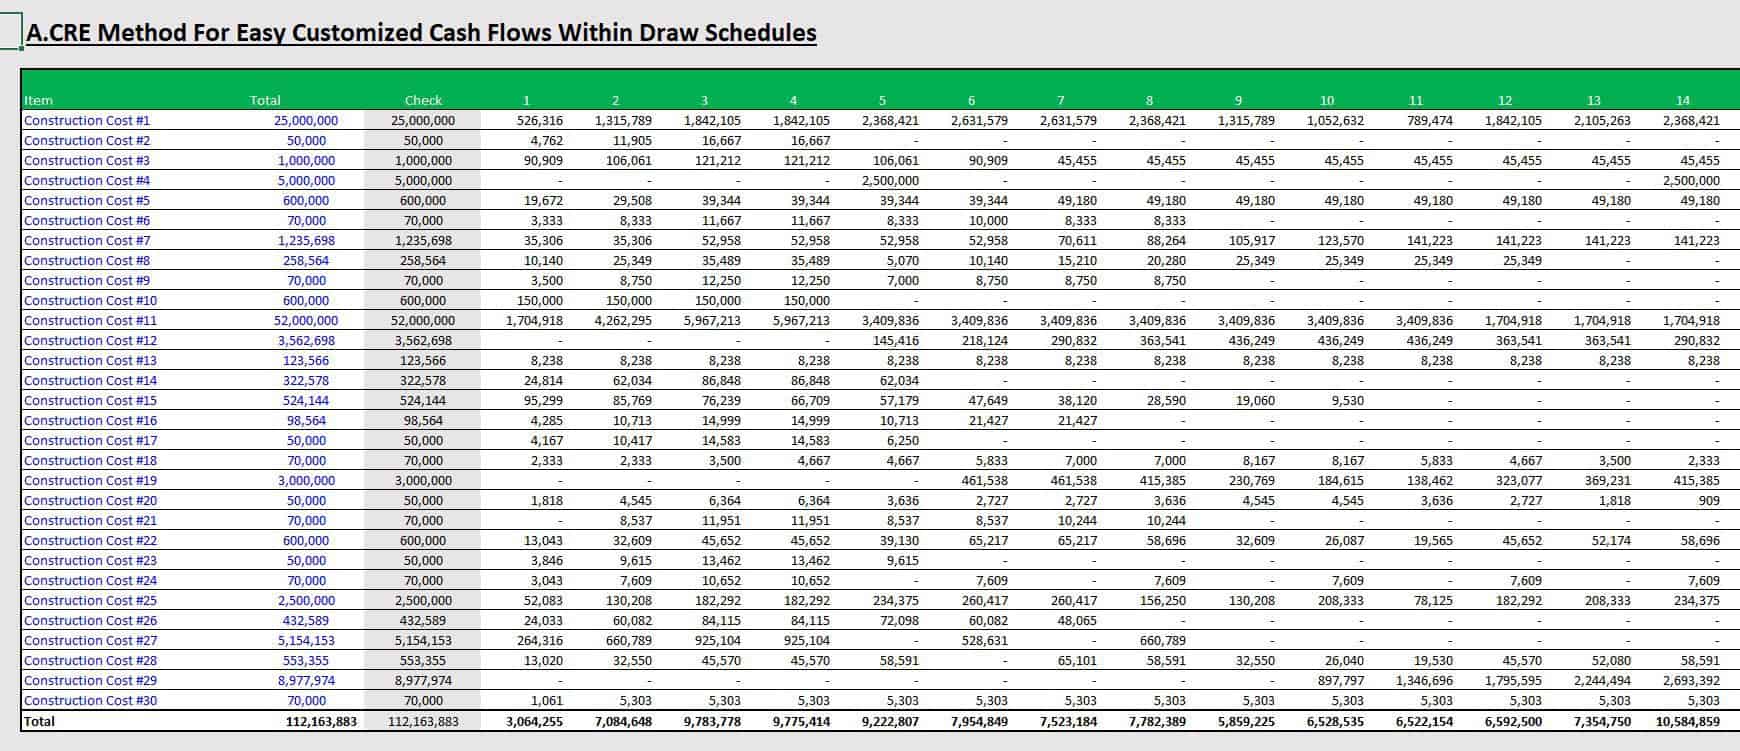
The model will auto calculate the dollar amount to be spent during each period based on the shape of the cash outflow created and the budgeted amount. Please download the model at the bottom of this post and watch the video below for a brief explanation of how to use it.
Video Walkthrough of the Draw Schedule
Download the Development Draw Schedule – Visually Customize Each Line Item tool
To make the Development Draw Schedule – Visually Customize Each Line Item tool accessible to everyone, it is offered on a “Pay What You’re Able” basis with no minimum (Pay $0 if you need) or maximum (your support helps keep the content coming – similar real estate tools sell for $25 – $100+ per license). Just enter a price together with an email address to send the download link to, and then click ‘Continue’. If you have any questions about our “Pay What You’re Able” program or why we offer our models on this basis, please reach out to either Mike or Spencer.
We regularly update this tool(see version notes). Paid contributors to the Development Draw Schedule – Visually Customize Each Line Item tool receive a new download link via email each time the tool is updated.
Frequently Asked Questions about the Development Draw Schedule – Visually Customize Each Line Item
Version Notes
Version 1.0
- Initial launch