Setting Up a New Real Estate Financial Model – Date and Period Headers Plus Formatting (Updated Apr 2022)
We’ve spent a lot of time here discussing and sharing different real estate models, and we’ve received a ton of feedback from our readers as a result. In some of that feedback we’ve received, several people have asked what period and date rows I prefer to use and how I setup a brand new model.
In response to that question, I thought I’d share with you the period and date rows I like to use at the top of my monthly cash flow reports, and give you the formulas I use to build those rows. I’ll also share some techniques I always employ when setting up a new worksheet in a new model, such as standard formatting, column widths, etc.
As a companion to the post, I’ve also recorded a quick video that shows you how to build them yourself and I’ve uploaded a quick Excel file for you to use in your own projects.
Are you an Accelerator member? Be sure to review the ‘Fully Dynamic Financial Model‘ section of the Anatomy of the Real Estate DCF to understand how this tutorial plays into the larger process of building institutional-quality real estate models. Not yet an Accelerator member? Consider joining the real estate financial modeling training program used by top real estate companies and elite universities to train the next generation of CRE professionals.
Your financial model is only as good as the ability of others to use and understand your model.
What Makes for a Good Model – Others Can Use It
We reiterate this point over-and-over here at A.CRE, but it’s worth repeating here: your model isn’t worth much if others can’t understand and use it. This point ultimately relates to your model’s overall usability, its user interface, the complexity of the formulas you write, and the consistency of the formatting you use.
Or in other words, the more simple the formulas, the more attractive and usable the interface and layout, and the more consistent the formatting, the easier it will be for others to use your model effectively. In this written and video tutorial, I share a few tips around this very point.
Title, Date and Period Headers – Real Estate Financial Modeling
In addition to sharing a few formatting and layout techniques I always use (e.g. hide unnecessary rows/columns, use in-cell labels, etc), the bulk of this tutorial revolves around how to create date and period headers. These headers are the foundation of any cash flow module, and are often used for other purposes in performing calculations.
In this tutorial, I build two headers: a Title Header and a Date and Period Header.
Title Header
The Title Header is pretty straightforward. It’s a header at the top of each worksheet that specifies the purpose of the worksheet, and other salient information related to the worksheet and the model. In this tutorial, the Title Header is one row tall. Sometimes, I’ll make my Title Header as tall as four or five rows tall, to allow me to include other items such as navigation buttons, subtitles, key metrics, etc.
Date and Period Headers
The Date and Period Header is a bit more involved. Personally, depending on its purpose, a Date and Period header can be anymore from one row to four rows tall. At minimum, it should contain a period row. In many cases, it makes sense to include a rollup period (e.g. year, when the period is month).
It’s also quite common to include the ending date of the period, and in rare cases the ending date of the rollup (e.g. year ending, when period is month). Personally, I will usually include a date header at the top of a worksheet, and then add one-row period headers above each subsection. If I need to call a date range in a given formula, I refer to the date header at the top of the worksheet.
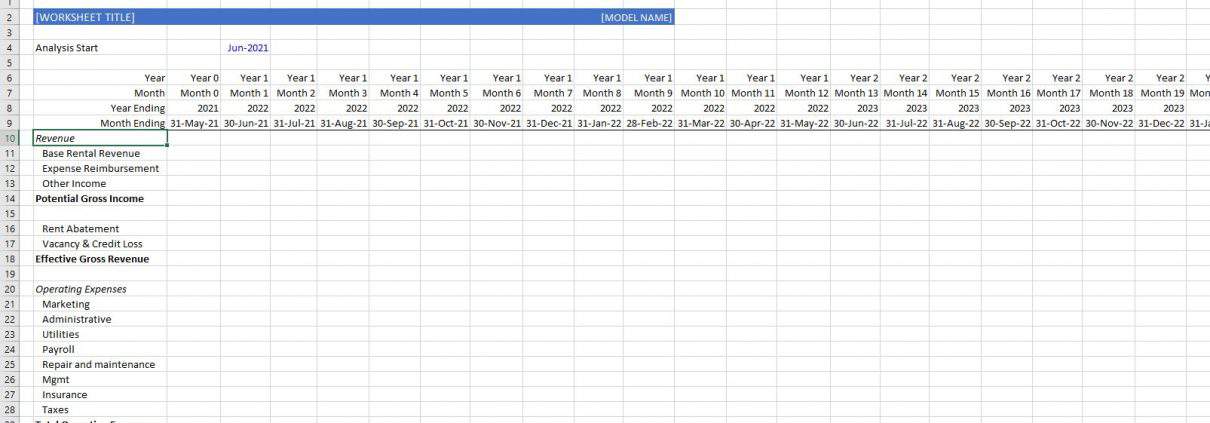
The four header rows I show you how to create in the below video are as follows:
- The ‘Year’, which is essentially the year period of any given monthly period (e.g. Year 1, Year 2, Year 3, etc.)
- The ‘Month’, which is the monthly period a cash flow is in (e.g. Month 1, Month 2, Month 3, etc.)
- The ‘Year Ending’, which is the actual year that a given year period ends (e.g. 2016, 2017, 2018, etc)
- The ‘Month Ending’, which is the actual date that a given month period ends (e.g. 7/31/2015, 8/31/2015, 9/30/2015, etc.)
Why Include a Date and Period Header?
The header has two purposes. First, it shows you what period a given cash flow relates to. If there is 500,000 in net operating income in a given period, it’s important to know whether than 500,000 is expected to occur in period 1 or period 100.
Second, the header allows you to perform calculations using the values in that header. You see that even in the video tutorial, where I use the ‘Month’ period row to calculate the ‘Year’ period row. Similarly, you might use the ‘Month’ or ‘Year’ period row to calculate income or expense growth, assign a loan payoff cash flow in a given period, start operations in a given period, and so forth.
Along that same vein, the header might be used as part of a cell range in a logic statement. So for example, if I’m using a SUMIF statement to roll-up monthly cash flows into an annual cash flow report, I’ll call out the ‘Year’ periods. If I have cash flows that should only be included within a certain date range (e.g. three months of rent abatement at the start of each new MLA lease), I’ll use the ‘Month Ending’ dates.
Likewise, I often use the ‘Month’ period to output a residual value in a specific month (e.g. sale in month 101), pay a leasing commission at the start of a new lease, or report a specific capital expense in a specific month.
In terms of how I use the ‘Year Ending’ value, the truth is that I rarely use it in my formulas, but I like the optics of showing the actual year for each monthly period. In other words, I like to be able to quickly see that, for example, year 9 ends in 2024 or year 12 ends in 2027. It is also a handy value to have, because a lot of analysts prefer to use the actual year (e.g. 2015, 2016, 2017) in their annual cash flow statements than a period (e.g. Year 1, Year 2, Year 3).
Video Tutorial – Setting Up a New Real Estate Model and Building a Date and Period Header
With all of that said, allow me to show you what I mean. This video is similar to many of our Watch Me Build videos, where I show you how I would perform a given modeling task. Feel free to open a fresh copy of Excel and follow along. If you’d like to reference the completed file, download the file below.
If you have any questions or comments, please don’t hesitate to reach out.
Compatibility
This version of the model is only compatible with Excel 2013, Excel 2016, and Excel 365.
Download the Tutorial Source File
To make this source file accessible to everyone, it is offered on a “Pay What You’re Able” basis with no minimum (enter $0 if you’d like) or maximum (your support helps keep the content coming – typical tutorials sell for $25 – $100+ per license). Just enter a price together with an email address to send the download link to, and then click ‘Continue’. If you have any questions about our “Pay What You’re Able” program or why we offer our models on this basis, please reach out to either Mike or Spencer.
We regularly update the file (see version notes). Paid contributors to the tutorial receive a new download link via email each time the tutorial is updated.
Version Notes
v2.0
- Added Title Header
- Hid excess rows and columns
- Updated analysis start date
- Added time zero
- Added in-cell labels
- Misc. formatting updates
v1.0
- Initial release
Frequently Asked Questions about Setting Up a New Real Estate Financial Model in Excel


