Case Study #11 – Residential Development Business Model: Build And Sell (Case + Solution)
This residential development case study explores the strategic planning and execution of Pinkstone Group’s latest project, Serene Homes, amidst the backdrop of the COVID-19 pandemic. As remote working becomes the norm and the demand for quality housing in serene environments rises, Mysore’s proximity to Bangalore’s bustling tech hubs makes it an attractive location for residential projects. This study delves into how Pinkstone Group is capitalizing on these shifts, focusing on their development of two high-rise towers with a total of 180 flats spread over 1.5 acres in the idyllic Vijayanagar. It examines the financial strategies and models adopted to optimize investment returns, address multi-currency investor needs, and evaluate operational strategies to ensure project success within the projected timeline. The case also looks into the company’s considerations for funding mechanisms, anticipated returns, cost estimates, and the impact of regulatory environments on project execution.
Practice makes perfect! This is a real scenario based on actual properties and situations. Names and locations have been changed for confidentiality reasons, but the fundamentals are real-to-life.
Each case study shared in this series mirrors real world situations, either in terms of the types of deals you will look at in various roles or the types of modeling tests you’ll be required to perform as part of the interview process. You can browse this and other case studies in the A.CRE Library of Real Estate Case Studies.
Note from Spencer and Michael: This is another post in a growing series that we call ‘International CRE’. Written by CRE professionals based outside of the United States, this series is a collection of deep dives into various CRE topics relevant to real estate professionals all over the world. One of the reasons we love the International CRE series is that things are not done the same in one country to the next, and this series highlights those differing perspectives.
This particular post is written by our friend Padmaa Iyer. Padmaa is an India-based Real Estate Fundraising Strategist and Chartered Accountant. She is also a long-time A.CRE reader and graduate of our Accelerator Program. A huge thank you to Padmaa for sharing her knowledge with the A.CRE community!
Context
This COVID-19 pandemic has forced people to think in ways they never bothered about earlier. Remote working is the new normal for most of the working population, especially in the IT sector. Village life is the new theme that seems to be driving the demand for quality housing for good health as well as peace of mind.
A Tier-2 city self-contained in itself, Mysore is one such ideal location due to its green riches and also the vicinity to India’s Silicon Valley of Bangalore, thereby offering abundant hustling opportunities as well.
Pinkstone Group, quite known for their quality residential developments across South India, has duly taken note of this shift of needs and the opportunity. They have a new project in their mind: Serene Homes, a residential apartments development deal in the idyllic locality of Vijayanagar, Mysore. Two high-rise towers of 90 flats each are built over 1.5 acres of land.
In order to leverage their own development experience as well as raise and manage other people’s money more smartly, Pinkstone guys are contemplating over various funding and operational strategies. They are looking for some serious number crunching help. A financial model that is logical, easy to understand, edit, and audit. Not just by them but also their investor audience.
Pinkstones wish to analyze all their strategies and input assumptions by means of a robust financial model.
- How lucrative is a joint development with landowners?
- Given their operational strategies and plans, how long will this project take to complete and get sold out?
- What are the returns from this venture for Pinkstone as well as their LP Investors?
- What is the sensitivity of the returns to various input variables such as construction cost, construction time, and the pricing points?
The foreign investors in this project would like to read the model in their language (read: currency). A financial model that is readable in at least five foreign currencies such as the USD, SGD, Euro, AED, and AUD in addition to INR.
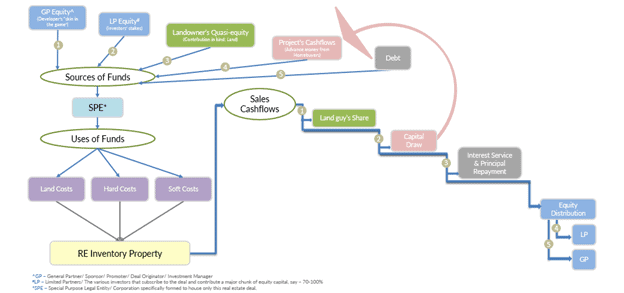
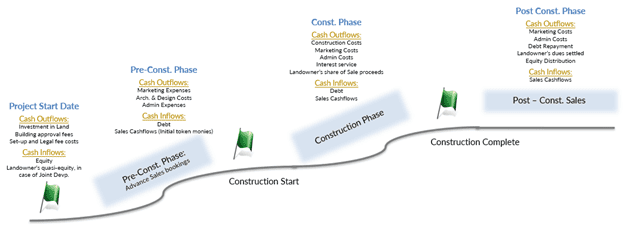
Visualizing the Story
Key Assumptions in the Residential Development Case Study
Land
Pinkstone has zeroed in on a land parcel of 1.5 acres in the target location. Asking price for the land is ₹1500 per square foot (PSF).
There are two options here:
Outright Purchase
Terms:
- Pay 50% upfront &
- Balance money in two equal installments over the next two months.
Joint Development with the Landowners
This is very much akin to a Revenue Participation Finance from the Landowners. Pinkstone has to pay little upfront and has the comfort of paying back the land guys as the project picks up speed and starts selling well.
Terms:
- Pay 5% of the land price as upfront sponsorship fees &
- Pay a 20% share of the proceeds from the sale of developed flats as a consideration for the land sale until 2.2x of the current market price of the land has been paid out.
In either case, presume an additional 5% of land cost as stamp duty and registration costs & 1.5% as brokerage costs. Brokerage cost is payable over the first three months since registration.
Development Plan
As per the zoning rules:
- Floor Area Ratio (FAR or FSI) is 3, and the Ground Coverage Ratio is 40%.
- The developers peg the Load factor at 35% on the Net Square Footage (NSF).
- This means an efficiency rate of 74.07% 1/(1+0.35)1/(1+0.35) on the Gross Square Footage (GSF).
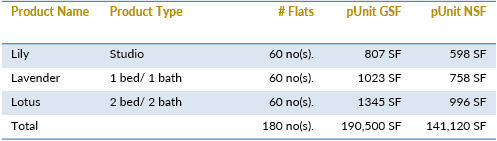
Product Mix
Construction Phasing
Pre-launch sales shall be an essential driver.
Construction of Phase 1 shall begin only once at least 40% of the all the flats has been pre-sold.
The developers shall commence the project with an aggressive promotional drive to ensure that the project achieves desired bankability.
The project consists of 2 towers of 90 flats each. Each tower will have an equal number of each of the above products.
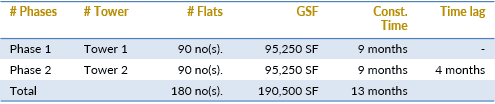
Maximum time length to complete the project and achieve final exit is expected to be 5 years.
Sales Estimates
As per RERA* regulations, sale price is to be quoted in terms of Carpet area (NSF).
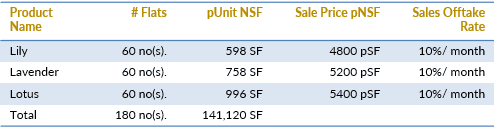
The sale price for each product shall be increased by 5% every 6 months.
*RERA ~ The Indian Real Estate (Regulation & Development) Act, 2016
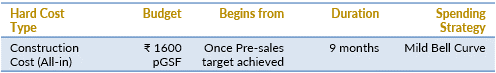
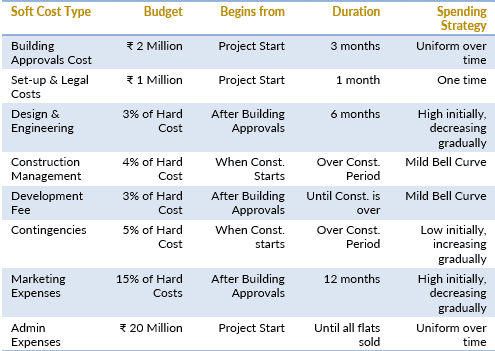
Cost Estimates
Hard Cost Estimates:
Soft Cost Estimates:
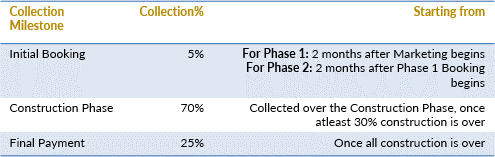
Sales Collection Mechanism
Collection plan is as the following:
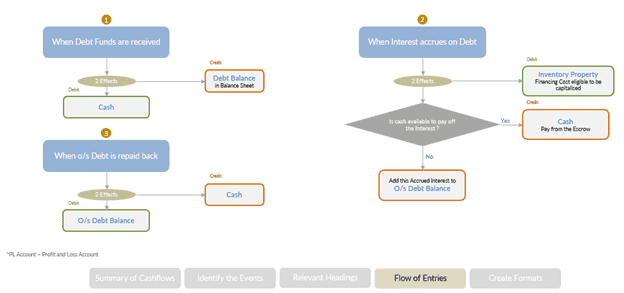
Debt
Bankers have agreed to fund the project’s operating deficit on the following terms:
- Land Cost: Will not be funded by the lenders.
- Interest Rate: 9% per annum. Interest shall be accrued and added to the repayable loan balance until it can be paid off.
- Tenure: 5 years.
- Repayment: To begin as soon as the construction of Phase 1 is over.
- Restriction on Sales Collection Monies: All proceeds received from the sale of flats shall be held in a separate escrow account and shall be available only to meet project-related costs. It shall not be available for equity distribution until all loan balances (including any accrued interest) are paid back.
- First Ranking Charge: Over all project assets.
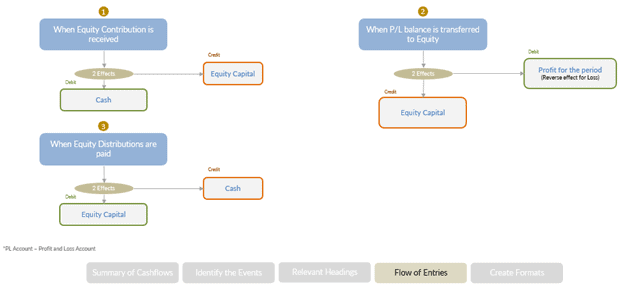
Equity
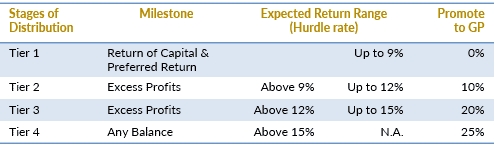
All the equity contribution shall come right at the start of the project, so as to fund the land costs, building approval costs, legal fees, and setup costs. In case of a joint development with landowners, Pinkstone stipulates that equity distribution to partners shall begin only once the landowners have also been paid their entire dues. Pinkstone as the Sponsor/GP (managing partners) and the Limited Partners (investing partners) shall contribute equity in the ratio of 20:80. LPs shall be required to pay a one-time acquisition fee to the GPs, equal to 1% of the equity contribution. This fee shall not be considered as part of their capital. Pinkstone proposes the following promote structure that will reward them appropriately for delivering superior returns and managing capital deployment efficiently.
Waterfall distribution terms:
Thought Process for the Residential Development Case Study
Key Elements
Threefold Leverage
The developer can access two additional sources of financial leverage in addition to traditional debt, thanks to the nature of the product—residential real estate for outright sale.
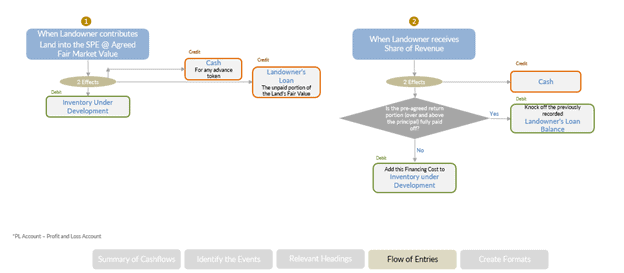
Joint Development with Landowner
In a joint development, the landowner contributes their land and the developer brings in their development expertise, creating a potential win-win scenario. The landowner gets to unlock a higher value by staying put through the development process, as compared to an outright sale at current market values. For the developer, this represents a significant source of funding, saving them a heavy investment in land in the initial phase and enabling an asset-light business model.
Consideration to Landowner:
- Either in Kind: By sharing a pre-agreed portion of the developed area (number of flats).
- Or in Cash: By sharing a fixed percentage of sales cash flows until a mutually agreed multiple of the current market value of land is achieved.
This arrangement is similar to a Revenue Participation Finance.
Why do we call it a Quasi-equity Loan from the Landowner?
It carries higher risks than traditional debt. The landowner gives development rights and power of attorney to the developer right at the start, while their timely exit realizations will depend upon the successful planning and execution of the project. The land goes as mortgage collateral for any further funding by means of debt.
Yet, it cannot be classified as equity because the landowner does not participate in the management of the project’s ongoing activities and has a first preference share out of the developed product/sale proceeds before anyone else.
Advance Money from homebuyers
This is another effective source of funding, reducing the need for external funding and increasing the bankability of the project. If held up in a separate escrow account and used strictly for project-related purposes, it ensures better monitoring over funds’ use, leading to the timely completion of the project. It also increases the credibility of the developer; timely delivery of the property to the homebuyers enhances the developer’s goodwill and personal brand, making fundraising much easier for their next ventures.
Debt
There is less need for debt as compared to a commercial development because advances from property buyers become an undeniable source of funding, if harnessed well. However, it results in riskier and costlier debt. Why? Ensuring smooth debt service can be a challenge in cases where sales off-take does not happen as planned. Unlike commercial real estate, there is no fixed income stream against which the debt service can be secured.
Stipulating Escrow on Sales Cash Flow Monies to Minimize Risks
In India, thanks to the Real Estate (Regulation and Development) Act, 2016 (RERA), at least 70% of the sales collections are to be held up in escrows. This means the funds cannot be diverted for distributions to equity or investment in another project until this project is delivered and all debts are paid off.
Increased leverage equals increased sensitivity of the equity returns to changes in cost inputs. With increased leverage, the fixed financing cost increases (e.g., returns to the landowner, interest on debt), and very little bandwidth remains to absorb the shock of an increase in any other operating cost such as construction cost. Sometimes, there is very little recovery possible by jacking up the sale prices either, because sale prices are mostly determined by market-driven factors.
Timing
- Timing of Various Events: How long will getting the building approvals take? How are the various budget monies going to be spent—straight-line, bell-curve, gradually decreasing, or increasing?
- Organizing the Sources of Funding: We need to know how much money is needed and when.
- Go-to Market Plan: How much pre-sales is targeted before starting the construction?
Pre-Sales: A critical factor for the project’s success that adds to the bankability of the project, thereby providing easier access to bank credit. Aggressive marketing in the initial phase helps generate good pre-sales booking, allowing the developer to leverage customer advances as a source of funding.
Return Metrics
Equity Return: A function of 3 things:
Profit Margins:
This simply reflects the difference between the sale price and the underlying cost to build the real estate property. Is it in line with industry standards? If not, what unfair advantages allow the developers to peg their product at a different price point? How strong is the demand?
Leverage:
How efficiently are the promoters able to use other people’s money?
Timing:
Are the developers able to deliver quality real estate on time? Are they able to ensure the sales on time? Timely completion and timely sales equal timely encashment of all investments. This speaks to their good planning skills and efficient building processes, as well as effective marketing strategies.
Three Simple Tools to measure Equity Returns
Internal Rate of Return
A metric that annualizes the rate of return for a range of cash flows, consisting of cash outflows at the start and a series of cash inflows (and maybe some outflows) over the investment period. However, IRR often yields an exuberant result.
Formula:
IRR = The discount rate at which initial cash outflows equal the present value (PV) of all future cash flows.
In MS Excel, we use the straightforward IRR/XIRR formula. Outside of Excel, we extrapolate a few probable rates and figure out the exact IRR rate by trial and error.
Equity Multiple
This is the most important measure for any business. It tells us how much the investment gives back in gross terms. For example, if I invested $100 and got back $400, that means I made 4x (400/100) on my investment. However, the Equity Multiple ignores time, the most costly input in any investment. Hence, the Equity Multiple is always accompanied by an annualized rate of return, to assess if the investment is worth both the money and the time.
Formula:
Multiple = Sum of all cash inflows / Sum of all cash outflows
Geometric Mean
Geometric Mean is a metric that annualizes/averages out the returns received from an investment over the number of invested years, considering the compounding effect. It often offers a more subdued result compared to IRR, which makes more sense in “Build and Sell” models. For a more in-depth explanation, I’ve written another article explaining Geometric Mean/CAGR vs IRR here.
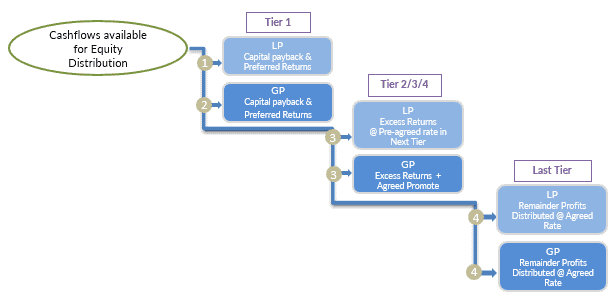
Equity Waterfall
European Waterfall in Build & Sell Models
In ‘Build & Sell’ Models, building and selling the units of the property are both part of the main operations. However, distributable profits for the equity partners appear much later in the timeline once all the external stakeholders are paid off.
In the American Waterfall style, distribution of returns to LPs and the GP happens out of operational income, and the capital is paid back at the time of the grand event of the sale of the CRE asset. The GP claims promotes during operations as well as at the exit.
But in the European Waterfall, no return or promote is paid to the GP until the LPs have been paid off their capital and preferred returns.
Since money is available only at the end of the lifecycle for either the LP or the GP, by default, the European style of distribution is what applies here.
Role of IRR in Equity Distributions
We bashed up IRR in the earlier slide as a lousy metric that inflates up the returns in some cases.
But there is no denial that IRR is an awesome measure to ensure a fair distribution of profits to the Equity Partners in accordance with their pre-agreed waterfall terms.
In the Tiered distribution structure, what happens is at each Tier, Return is calculated on the outstanding capital using the APY. Once the pay-outs are made corresponding to the outstanding capital and the accrued returns, the remaining undistributed Cashflows go to the Next Tier, to be distributed in the same manner but now with a higher expected return rate.
At the end of every Tier (except the last one), if we calculate the IRR, it is equal to the applied APY rate and offers us a great sanity check thus ensuring a controlled distribution at every stage.
IRR serves here as a good cross-check tool.
Pointers for the GP
- What unfair advantages does the GP have to claim the Promotes that they do?
- Skin in the Game?
- Valuable EPC Partnerships?
- Lending Relationships?
- Risk Management skills?
- Operational expertise?
- Outreach Strategies?
- Past Track records?
Basics Touch-up
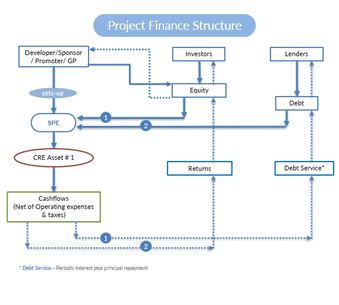
Real Estate Deals essentially follow Project Financing Principles. This is the premise upon which our Financial Model is built. To understand why this is the case, read my other article on project financing vs corporate financing.
Area Concepts
Ground Coverage Ratio/Building Coverage Ratio
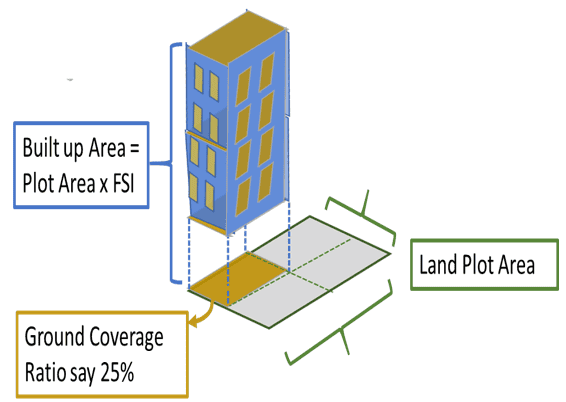
This is the ratio of the built-up space covering the ground of a building to the land plot area. The land use zoning authorities or local municipal authorities stipulate a certain percentage as the ground coverage ratio for various types of residential and commercial real estate properties.
Floor Area Ratio/Floor Space Index
This is the ratio of all the built-up area across all the floors or levels of a building to the land plot area.
That means, Total Built-Up Area = Land Plot Area x FSI.
The FSR is stipulated by the land use zoning authorities to regulate landscape planning and development. A higher permissible FSI denotes a stronger density of population and the need for stronger infrastructure.
Gross Square Footage/Total Construction Area/Super Built-Up Area
This represents the total constructed area, including occupiable as well as common areas such as lobbies, clubhouses, gyms, etc., built inside the residential complex, but it excludes open areas such as parks and gardens. The costing of the saleable property units is done as per this area.
Net Square Footage/Total Saleable Area/Net Usable Area/Carpet Area
This is the area of the housing unit that is actually used by the buyer or tenant. The sale price is determined or lease rent is charged based on this area.
Efficiency Ratio
This is the ratio of the NSF to the GSF. A portion of the GSF will be taken up in building common utilities such as the HVAC systems, lobby, restrooms, etc.
Loading Factor/Add-on Factor/Common Area Factor
This is the portion of the common areas expressed as a percentage of the NSF.
GSF = NSF * (1 + Load Factor)
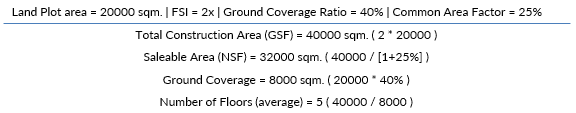
Example: GSF = 5000 SF, Load Factor = 25%.
What is NSF?
Answer: NSF = 5000 / (1 + 25%) = 4000 SF.
Summarising Example
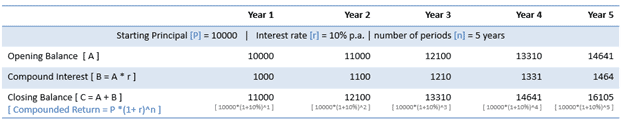
Compounding – “The Eighth Wonder”
We all know what compounding is.
Interest earned on a Cumulative Basis:
Compound Interest = (Principal + Previously Accumulated Interest) * Interest Rate.
This happens when the interest/cost of the money is not paid out immediately but rather reinvested towards the intended use, i.e., added to the principal balance.
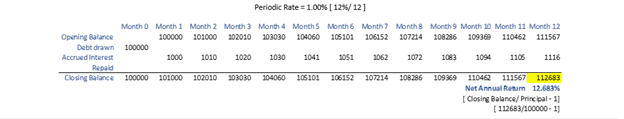
Enter APR & APY
APR & APY mean the same as long as the frequency of compounding is annual. They differ in formula and meaning only in ‘less than year’ compounding periods.
APR ~ Annual Percentage Rate
- Simple nominal interest rate.
- APR is used in the context of costs.
- Examples: Inflation rate, interest rate on debt.
Formula for Periodic Rate:
Periodic Rate = APR / n
Where n = frequency of compounding within a year.
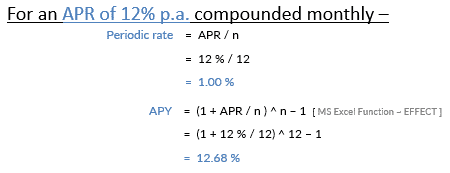
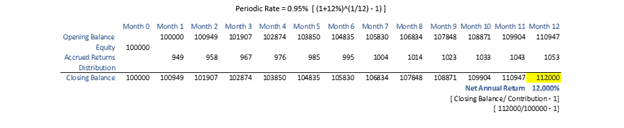
APY ~ Annual Percentage Yield
- Annual Effective Rate.
- APY = (1 + APR/n)^n – 1
- APY already factors in the compounding effect.
Formula for Periodic Rate:
Periodic Rate = (1 + APY)^(1/n) – 1
Where n = frequency of compounding within a year.
APY is used in the context of net returns expected by investors.
Example: Equity return rate.
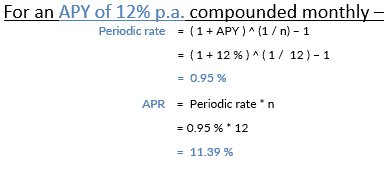
For any given APR, the corresponding APY will always be a little higher depending on how many times it is compounded within the year.
Illustrating APR & APY
- APR: When the lender accrues an interest (APR) of 12% per annum every month on a loan advanced of $100,000.
- APY: When equity investors are expecting an Internal Rate of Return (IRR or APY) of 12% per annum on a capital contribution of $100,000.
Accounting Side – 2 Approaches to Financial Modeling
Pure Cashflow Approach
Investment is purely analyzed in terms of CASH.
Meaning: The Financial Model documents the entire lifecycle of the Investment Proposition.
Best suited for: Project Finance.
For example, most CRE deals, cash cow investment opportunities.
Goal: Does the investment make sense and deliver the investor’s expected returns?
Investor would want to know only 2 things:
- What cash is required to be invested?
- What cash will they reap out of the investment?
- And of course, the timing of the various cashflows.
Process: Cash is analyzed through a simple and logic-driven layout:
- Investment Cashflows–(Outflows)
- Operating Cashflows–(Net Inflows)
- Exit Cashflows–(Net Inflows)
In the case of a ‘Build & Sell’ model–Investment & Exit Cashflows, both form part of the operations.
Left-out: The non-cash item of depreciation, income tax expenses, credit given for sales/incomes, and received for purchases/expenses doesn’t get calculated. However, discounts for any bad debts and necessary expense provisions are duly considered in calculating the net cash flows.
Balance Sheet Approach
Data from past years’ Balance Sheets is extrapolated with estimates for the future to understand the impact of new investments.
Meaning: The Financial Model strives to show how the new Investment Proposition adds value to the existing business situation.
Best suited for: Corporate Finance.
For example, M&A deals, expansion plans of a growing corporation.
Goal: What synergies (e.g., (2+2) > 4) will the merger offer? How will the increased investment add to the bottom-line of the firm?
Process: Fresh inputs as well as past insights are channeled through the Balance Sheet and P&L Statement so as to see how the future periods in the investment analysis period will look like.
Left-out: In order to calculate return and valuation metrics such as NPV/IRR/Enterprise Value/Equity Value, we have to pull back into pure Cashflow Analysis formats.
Need for the Balance Sheet
We follow the clean and sharp ‘Pure Cashflow’ Approach to analyze RE deals. That means, if needed, “Projected” Balance Sheets will have to be drawn out from the Financial Model. A few good reasons:
- Legal & Regulatory Requirements We may have to annex a projected balance sheet as part of the legal documents such as the Private Placement Memorandum. Our bankers may want us to submit projected financial statements. Perhaps, a Cashflow model may not suffice.
- After Tax Analysis Having a projected set of financial statements enables us to know the tax impact. Tax is payable out of income. To know the income, we must have the P&L account that is part of the Balance Sheet.
- Investor’s Expectation Investors may want to see how the modeled numbers look like in the Balance Sheet.
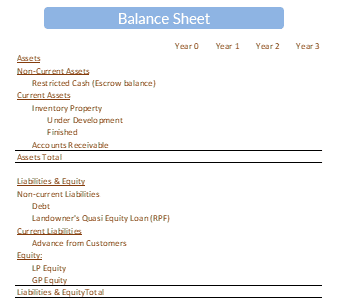
*Please note that by Balance Sheet I mean all the 3 financial statements – Balance Sheet as well as P/L account and Cashflow Statement. The word ‘Balance Sheet’ has a better and quicker recall value than the long, boring – “Financial Statements”. 😊
Financial Statements: Primer
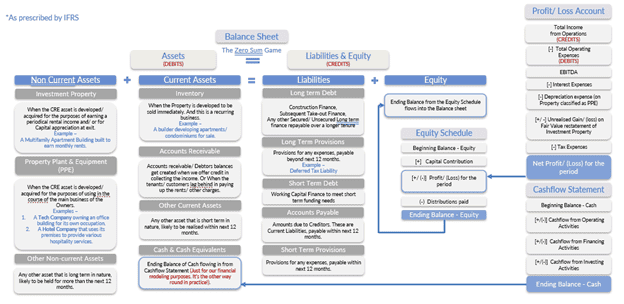
Financial Statements consist of:
1. The Statement of Financial Position a.k.a. The Balance Sheet
- Financial health of a business at any point in time.
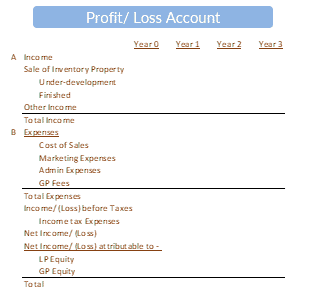
2. Statement of Income a.k.a. The Profit/Loss Account
- Net profit/loss earned during a period; this balance rolls into the Equity, that further rolls into the Balance Sheet.
3. Statement of Other Comprehensive Income
- The Unrealized Incomes/Losses that cannot be included in the P/L account yet.
- An advanced reporting concept, we are not delving into right now.
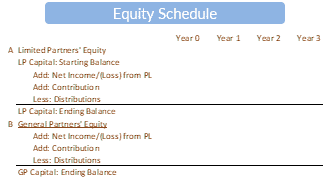
4. Statement of Changes in Equity
- (the Equity Schedule)
- Rolls into the Balance Sheet.
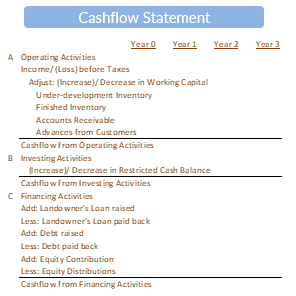
5. Cashflow Statement
- (the Schedule of Cash balance with a breakup into 3 main activities)
- Closing Cash balance from the Cashflow Statement rolls into the Balance Sheet (only for our modeling purposes!). In practice, the Cashflow Statement is drawn from the Balance Sheet and the P/L by segregating cashflows into the 3 broad types of transactions (see next page).
6. Notes
- (accounting policies and presumptions and other details of the items reported in the Balance Sheet).
Some Accounting 101
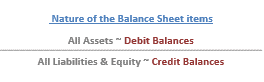
Accounting Sanctity
My business is an entity separate from me. If I invest my own (equity) money in my business, the business still has an obligation to return my money at the end of its lifecycle. For every debit, there is a corresponding credit.
Essence of Double Entry Accounting System:
Lends accuracy and completeness to the accounting process. The zero-sum equation.
Matching Concept
All the revenues and the related expenses should be recognized in the same reporting period.
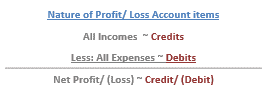
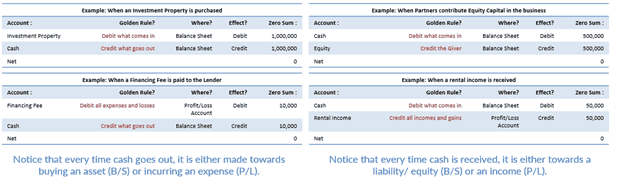
The 3 Golden Accounting Rules
- Debit the receiver, credit the giver.
- Debit what comes in, credit what goes out.
- Debit all expenses and losses, credit all incomes and gains.
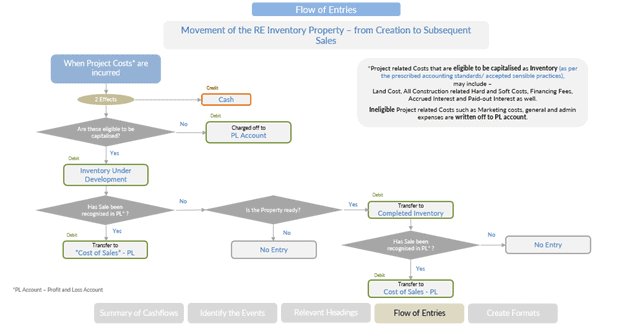
To Capitalise or Not to Capitalise?
One important question that frequently bugs accountants is whether to capitalize an item of cost or write it off in the P/L account.
This decision calls for prudence and also references the accounting standards prescribed by regulatory authorities.
Capitalization will lead to a higher net worth (equity balance) versus a write-off.
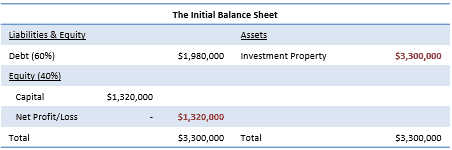
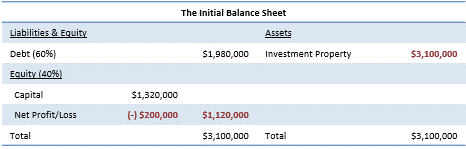
Example: In the books of one SPE, breakdown of a CRE investment property cost:
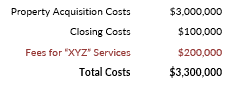
If this XYZ Fees is Capitalised
If this XYZ Fees is not Capitalised
Steps to the Balance Sheet
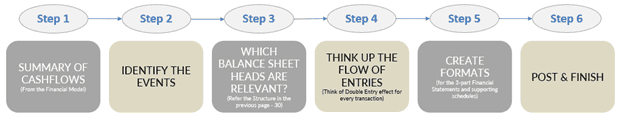
Let’s look at the first 5 steps closely. We can handle the 6th one in Excel.
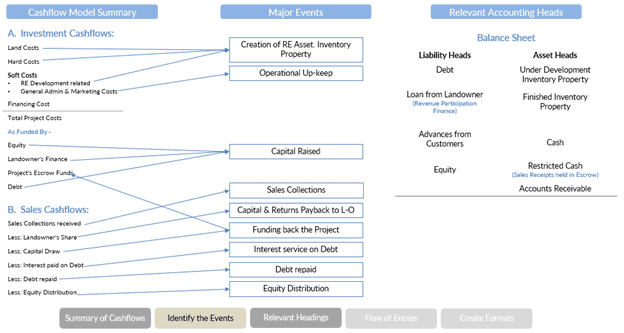
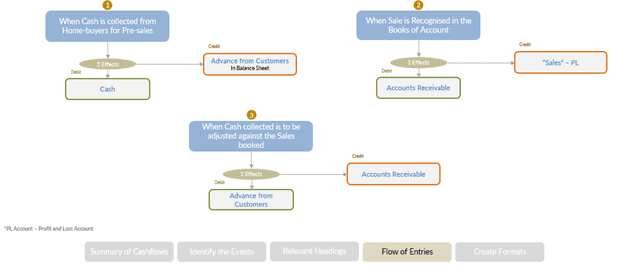
- Collecting Advance Monies for the Pre-Sales: Later, when the sales are recorded in the books of account, adjusting the monies received against the recorded sales.
- Transactions with the Landowner: Land contribution & receipt of a pre-agreed share of revenue towards returns and capital payback.
- Transactions with the Debt Lenders: Funds receipt, interest service, and repayment of debt.
- Transactions with Equity Partners: Receipt of contribution, transferring profit/loss balance to equity at the period-end, payment of distribution.
Recording Sales in the Books
Unique Case of Residential Development
As we observe in the case study, we are anticipating pre-sales. That means we are booking sales and collecting advance monies from customers even before the property is ready for buyer’s occupation. In such a scenario, can we treat those advances collected as our ‘Sales’ in the P/L account also? No. Then should we wait until all the construction is over and the building is ready? Again, no.
IFRS 15 says that sales in such cases can be recognized over the period of development time, subject to the condition of certainties. (My paraphrasing!)
When and How Much Sales Can Be Booked?
The Institute of Chartered Accountants of India has further offered some great guidance in this respect.
From When?
Sales in the books can be recorded if all the following four conditions are fulfilled:
- All necessary building approvals are in place.
- At least 25% of the construction costs have been incurred (excluding land cost).
- At least 25% of the total built-up area has been sold out.
- At least 10% of the sale price has been collected from each home-buyer.
How Much?
Proportionate to the extent of work completed, i.e., in the ratio of – Project Costs incurred to date (including land) / Total Estimated Project Costs (including land).
Accounting for Cost of Sales
All the property development costs are first accounted as part of ‘Under Development Inventory’ in the Balance Sheet. As and when we account for sales, we pull out a proportionate amount (corresponding to the % NSF sold) from the ‘Inventory’ balance and charge them off to the P/L account as the ‘Cost of Sales’.
For a detailed reading, check out the below documents from ICAI, EY, PwC, Grant Thornton available in the public domain:
- Financial Reporting Format as per IFRS from EY – https://www.ey.com/en_gl/ifrs-technical-resources/good-real-estate-illustrative-financial-statements-2019
- Revenue recognition guidance from ICAI – https://kb.icai.org/pdfs/PDFFile5b28b00f579eb6.35674209.pdf
- Revenue recognition as per IFRS 15 from PwC – https://www.pwc.com/gx/en/audit-services/ifrs/publications/ifrs-15/ifrs-15-industry-supplement-real-estate.pdf
- Revenue recognition as per IFRS 15 from GT – https://www.grantthornton.global/en/insights/articles/get-ready-for-ifrs-15-rec/
Calculating Tax Expenses
My Two Cents on Tax Workings
All this while our discussion has centered on the analysis of the investment and the strategies around it, and also a bit of accounting. Tax is a vast subject and very much local in nature. Every jurisdiction has its own dos and don’ts prescribed for businesses. At a financials forecasting stage, determining a ballpark amount of tax costs should be more than sufficient for our purposes. I don’t think we must be too worried about going into detail into specifics of the tax laws, especially in a for-profit business like real estate (I mean, your government will not treat you any differently and hand you any unusual tax credits for doing regular business, unless, of course, you are doing something to stop climate change, like green building or building affordable houses).
This is why I have kept tax-related workings in the financial model very simple and generic. But I am sure you can chisel it further as per the specific needs of your deal using the various modeling techniques deployed in this model.
Two Things to Understand With Respect to Tax Calculation:
Calculation of Tax Payable
Below format explains the process:
- Net Profits as per P/L Account
- Add: Expenses not allowed as per Tax Laws, but accounted in Books
- Less: Expenses allowed as per Tax Laws, but not accounted in Books
- Taxable Income
- Less: Utilizing any tax loss previously suffered
- Net Taxable Income
- Apply the applicable tax rate to this ‘Net Taxable Income’
- Tax Loss Balance
Tax is payable only on net profits. What about the years when the business incurs losses? These losses can be carried forward and set off against profits earned in future periods. In some jurisdictions, tax losses expire after a stipulated period of time.
Conclusion
This residential development case study outlines the strategic and financial planning behind Pinkstone Group’s Serene Homes project in Mysore. The analysis shows how the project capitalizes on increased demand for quality housing post-COVID-19, using a combination of funding strategies and compliance with IFRS 15 and ICAI guidelines to ensure transparency and accountability.
The financial model supports international investors with multi-currency options, reflecting Pinkstone’s commitment to attracting a diverse investor base. By focusing on pre-sales, phased construction, and strategic marketing, the project aims to optimize cash flows and accelerate returns. Overall, Serene Homes could set a new benchmark for real estate development in Tier-2 cities, adapting to evolving urban trends.
Try Another Case: In the same way that A.CRE has made publicly available over 60 institutional-quality real estate models, we're now on a mission to build the largest library of free real estate case studies. Browse the library today.
Download the Industrial Case Study files
In addition to the web-based case, we’ve created a complete Excel file with the solution, and a PDF version to download and use offline. As with our real estate financial models, this case study and solution are offered on a “Pay What You’re Able” basis with no minimum (enter $0 if you’d like) or maximum (your support helps keep the content coming). Just enter a price together with an email address to send the download link to, and then click ‘Continue’.
We occasionally update these cases and solutions (see version notes). Paid contributors will receive lifetime access to the case, solution, and all updates.
Frequently Asked Questions about Residential Development Business Model: Build and Sell
What are the two land acquisition strategies analyzed in this case?
The two strategies are:
Outright Purchase – 50% payment upfront, balance in two equal monthly installments.
Joint Development with Landowners – 5% upfront sponsorship fee, and 20% of sale proceeds until 2.2x of land value is paid.
What key assumptions shape the financial feasibility of Serene Homes?
Key assumptions include:
₹1500 per SF land cost, 1.5 acres total.
FAR of 3 and Ground Coverage of 40%.
180 flats built across two towers.
Construction starts after 40% pre-sales.
Sale prices increase 5% every 6 months.
Multi-currency reporting in INR, USD, SGD, Euro, AED, and AUD.
How is the project funded and what role does debt play?
Funding sources include equity (20% GP, 80% LP), advance money from buyers, and bank debt. Land cost is not funded by lenders. Debt carries 9% interest, accrues until construction completes, and is repaid over a 5-year term from project sales proceeds held in escrow.
What financial return metrics are calculated in this case study?
Three primary metrics are used:
Internal Rate of Return (IRR)
Equity Multiple
Geometric Mean (APY)
These help assess profitability, timing of cash flows, and capital efficiency.
What is the purpose of the equity waterfall structure used in the model?
It ensures tiered distribution of profits between LPs and GP. Under the European waterfall, the GP receives promote only after LPs are fully repaid their capital and preferred returns. IRR serves as a checkpoint to monitor fair tier transitions.
How are pre-sales and buyer advances treated in the model?
They are held in escrow and used only for project costs. Pre-sales boost bankability and reduce need for external funding. Under IFRS 15 and ICAI guidance, revenue is recognized proportionally based on project completion.
What makes the joint development strategy attractive?
It provides quasi-equity financing by deferring land payments through revenue share. This asset-light model reduces upfront capital needs and aligns the landowner’s interest with the project’s success.
What are the accounting principles relevant to recognizing sales and costs?
Sales can be recognized once all four ICAI/IFRS criteria are met. Costs are first recorded as inventory and then matched proportionally to sales in the P&L. This ensures compliance with the matching concept and revenue recognition standards.
What modeling approach is used and why?
The case uses a Pure Cashflow Approach to focus on investment lifecycle: investment outflows, operating inflows, and exit returns. It avoids non-cash items like depreciation, emphasizing cash-based decision-making—ideal for real estate project finance.
How does the financial model support international investors?
The model includes currency toggles for INR, USD, SGD, Euro, AED, and AUD. This ensures clarity and accessibility for foreign LPs, aiding transparency and simplifying return comparisons across currencies.
Version Notes
v1.0
- Initial release
About the Author: Padmaa Iyer is a Chartered Accountant from India and a long time A.CRE fan. Her experience has spanned fundraising strategy for real estate and solar developers, helping refine strategy, strengthen financial models, and craft compelling investor pitches. Connect with Padmaa via Linkedin.


