

How the Tower Was Built: 2008 Crisis, Part 3
Part 3 of my series working through the 2008 financial crisis from a real estate perspective. If you’re new to the series, Part 1 I looked at why the mortgage was trusted, and in Part 2 I followed a single mortgage payment down the chain and watched the risk detach from everyone who touched it. Here I want to open up the machinery the investment bank used once it had that payment stream in hand, and work through CDOs and tranches, the subordination math, the correlation assumption, and the ratings, that let the riskiest mortgages in America wear the same AAA stamp as U.S. Treasuries.
At the end of Part 2, I left a payment sitting inside an investment bank, and I promised that this was where the real engineering began. We watched a monthly mortgage payment travel from a homeowner out to a global investor, shedding its risk at every stop. But I skipped the most important step. Before that bond could be sold, it had to be built, and the way it was built is why a pile of subprime loans could carry the same rating as the safest debt on earth. This part is more technical than the last two, on purpose. The engineering is where the story lives.
Let me open up the machine.
The Waterfall You Already Know
If you work in commercial real estate, you already understand the core idea, even if you have never touched a mortgage bond. Think about the capital stack. Senior debt is paid first, mezzanine sits behind it, and common equity is last in line and absorbs the first loss. The order is the whole point. Each layer takes a different position in the payment waterfall and, in exchange, earns a different return and carries a different risk.
A mortgage bond works the same way. Take the pool of thousands of loans from Part 2 and, instead of passing every payment through untouched, carve the cash flows into layers. Lewis describes it as a tower. The top floors are paid first, suffer losses last, and receive the highest rating and the lowest coupon. The bottom floors are paid last, absorb the first losses, and receive the lowest rating in exchange for the highest yield.
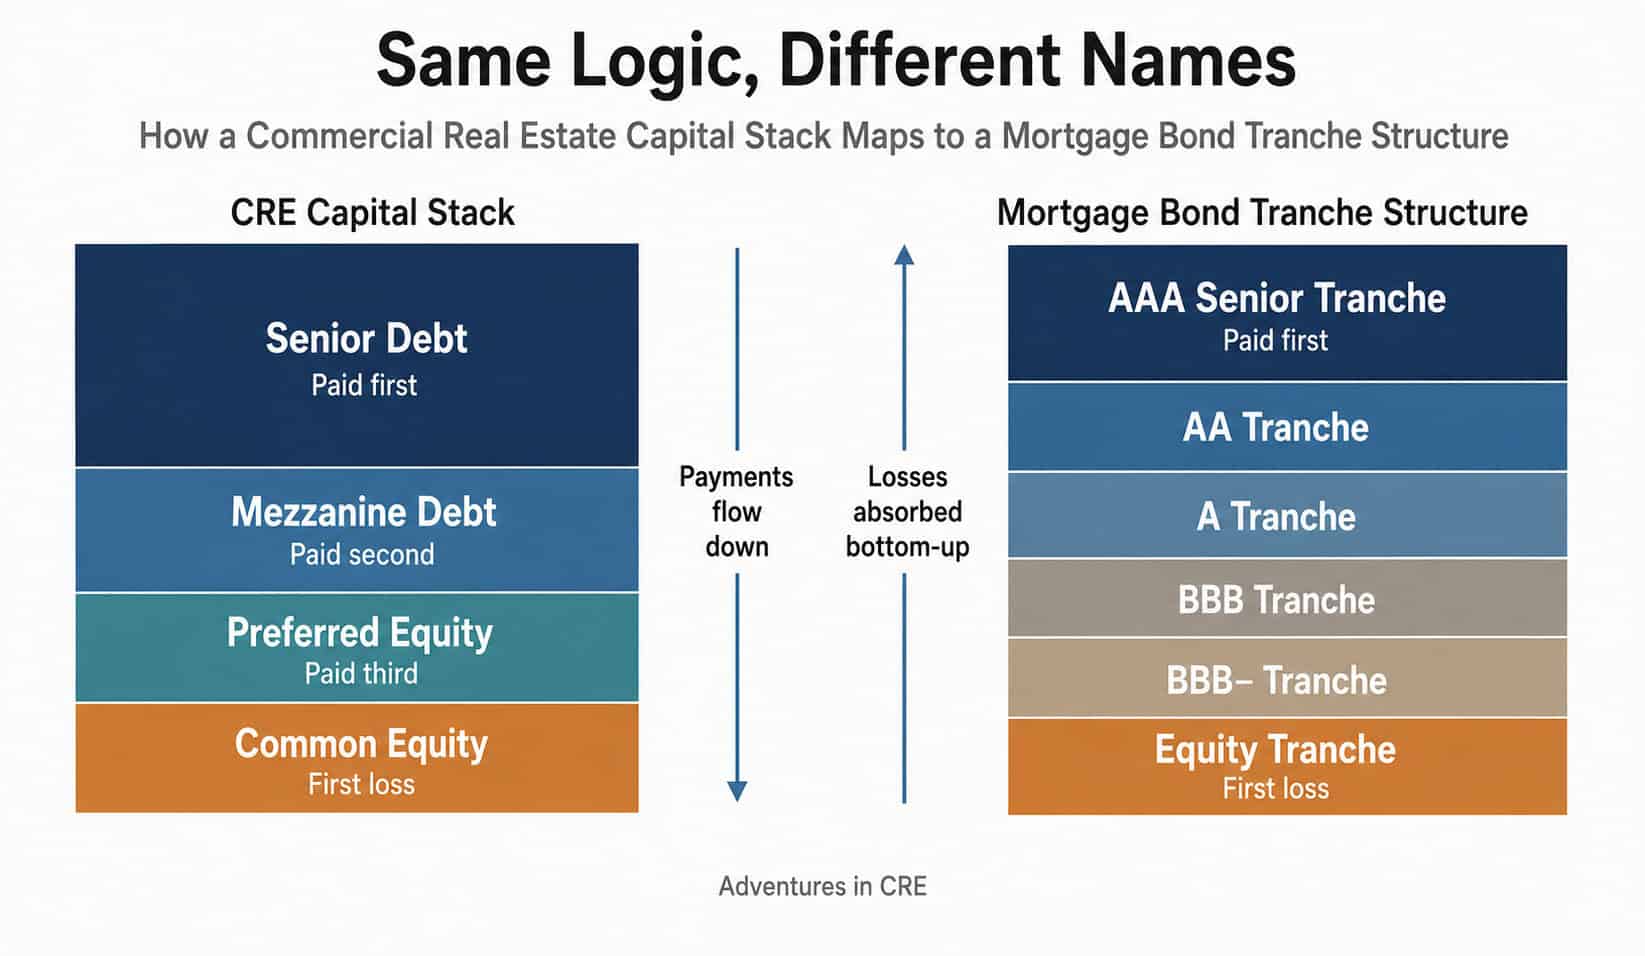
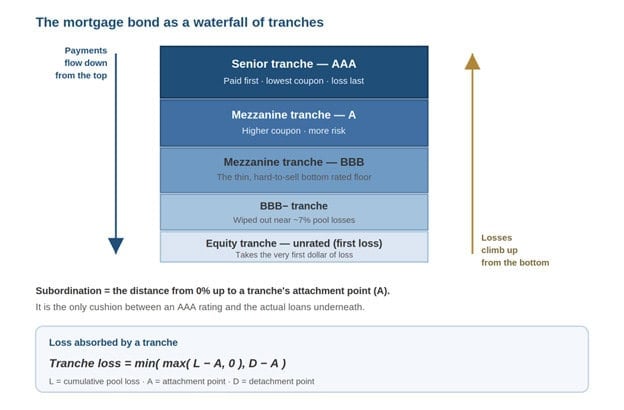
These layers are called tranches, from the French for slice. The structure is governed by a rule set the industry calls the waterfall, and it usually runs sequential-pay: principal and interest flow to the most senior tranche until it is satisfied in full, then to the next, and so on down. The lowest layer, the equity or first-loss tranche, receives only what survives the trip down. Subordinated tranches have to wait for enough cash to flow past the layers above them before they see a dollar.
This is where it pays to slow down, because it’s where I found the actual mechanics of the thing. The safety of the senior tranche is defined by two numbers: its attachment point and its detachment point. The attachment point is the level of cumulative losses in the underlying pool at which that tranche begins to take a hit. Everything below the attachment point is absorbed by the tranches beneath it. So if a triple-B-minus tranche sits at the bottom of the structure, it might have an attachment point near zero and be wiped out entirely once pool losses reach a strikingly low threshold.
Written as a simple relationship, the loss a given tranche absorbs is just the part of the pool’s total loss that falls inside its own band:
Tranche loss = min( max( L – A, 0 ), D – A )
where L is the cumulative loss on the underlying pool, A is the tranche’s attachment point, and D its detachment point. Below A, the tranche loses nothing since the layers beneath it are still absorbing. Above D, it is already wiped out and further losses climb to the next tranche up. A senior tranche with an attachment point of, say, 7 percent takes its first dollar of loss only once the entire structure beneath it, every junior floor, has been exhausted. That distance from zero to A is the subordination, and it is the only thing standing between an AAA rating and the actual loans.
The real numbers here are sobering. In the subprime bonds of the mid-2000s, the triple-B-minus tranche, the bottom rated floor of the building, was often written to go to zero once losses in the underlying pool reached roughly 7 percent (figures throughout this section from Lewis’s The Big Short). Not 30 percent. Seven. And by late 2005, with house prices still rising, default rates were already approaching 4 percent. The entire investment-grade portion of the tower was resting on the belief that cumulative losses would stay inside a very thin band. The triple-A at the top was not safe because the loans were good. It was safe only because a few percent of subordination sat beneath it, and everyone agreed to model the loss that would eat through that subordination as a remote event.
To me, that is the first thing worth sitting with. Subordination converts the quality of the loans into a question about the shape of the loss distribution. The rating is not a verdict on the borrowers. It is a bet on how bad losses can plausibly get.

The Problem of the Basement: The Tranches Nobody Wanted
This works beautifully as long as someone buys the bottom floors. And for a while, someone did.
But look at what the tower produces. Out of a bond built entirely from subprime loans, only a thin band comes out rated triple-B, the lowest floor with a rating still attached. The senior tranches sold easily, since the whole world wants AAA paper. The trouble was that bottom band. It was the riskiest rated slice, it was hard to move, and every mortgage bond on the Street produced another one just like it. Wall Street was accumulating basements nobody wanted to live in.
So the question that hangs over the middle of this story is simple: what do you do with all those low floors nobody wants?
The answer is the piece of engineering that turned a large American credit problem into a global one.
CDOs and Tranches: The Arbitrage Hidden Inside the Math
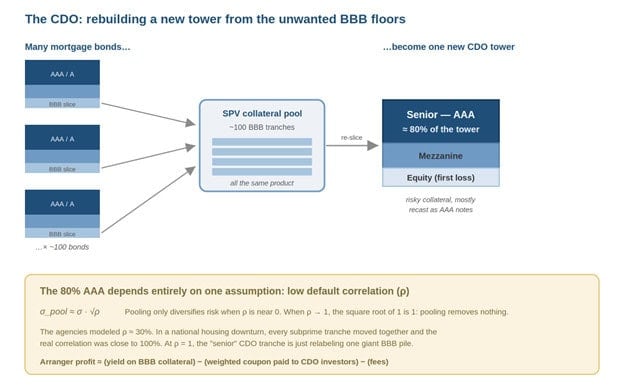
Here is the move. You gather a hundred of those unwanted triple-B tranches, each from a different mortgage bond, drop them into a special-purpose vehicle, and use them as collateral to erect an entirely new tower. Then you slice that new tower exactly as before: senior, mezzanine, equity. And when the agencies were done, roughly 80 percent of that new tower, built from nothing but triple-B slices, came out rated triple-A.
This structure was the collateralized debt obligation, or CDO. Lewis describes it without flinching. In his telling, it was a machine that turned lead into gold.
It is worth slowing down to see exactly where the gold supposedly comes from, because there is a real mathematical claim buried in here, and it is not obviously absurd. The argument goes like this. Any single triple-B tranche is risky. But if you pool a hundred of them from different bonds, different regions, different originators, then, so the model says, they will not all fail together. Some will default, most will not, and by stacking a fresh subordination structure on top of the pool you can carve out a senior claim that only suffers if an improbably large fraction of the hundred fail at once. That senior claim, the model concludes, deserves a triple-A.
Everything depends on one input: the default correlation among the underlying tranches. And this is the number that quietly did all the work.
Correlation here runs from zero, meaning the tranches default independently of one another, to one, meaning they move in lockstep. The math of pooling is unforgiving about this parameter. For a pool of n similar exposures, each with loss volatility σ, the volatility of the pooled loss does not fall to zero as you add names. It converges toward:
σ_pool ≈ σ · √ρ
where σ_pool is the volatility of the pooled loss, σ the loss volatility of any single exposure, and ρ the average pairwise correlation between them. Read that relationship slowly, because it is the whole story. If ρ is near zero, the pooled volatility shrinks as the pool grows, the independent defaults wash out, and a genuinely safe senior claim can be carved from risky pieces. This is ordinary diversification, and it is real. But if ρ is near one, the square root of one is one, and pooling removes nothing. A hundred perfectly correlated triple-B tranches behave exactly like one giant triple-B tranche. Slicing that pool into senior and junior claims is pure relabeling, because a shock that hits one hits all of them at once.
So the entire investment-grade rating of a subprime CDO rested on the claim that correlation was small. How small? According to Lewis, Moody’s and S&P judged the pools of triple-B bonds to have a correlation of around 30 percent. That number was not observed. It was produced by a model, the Gaussian copula, which collapsed the tangled dependence among thousands of loans into a single correlation parameter, typically calibrated on credit default swap spreads from a short, benign window rather than on any long history of mortgage defaults. It was an elegant equation resting on almost no relevant data.
The true correlation was not 30 percent. As Lewis puts it, when one collapsed, they all collapsed, because the same broader economic forces drove all of them. Every one of those hundred tranches was the same product: subprime mortgages, underwritten in the same few years, under the same falling standards, priced off the same national belief that home values do not fall together. In a nationwide downturn the real correlation was close to one, and at correlation equal to one the multi-billion-dollar edifice collapses back into what it always was: a giant, undiversified pile of the worst loans in America.
That single parameter, unobservable, modeled as low, and in reality close to one, is to me the hinge the whole crisis turns on. Part 5 is where it moves.
It is worth completing the arithmetic, because it explains why anyone bothered. The CDO’s collateral, those triple-B tranches, yielded a high coupon because it was risky. The rated notes the CDO sold, mostly triple-A once the model blessed them, paid a much lower coupon because they looked safe. The arranger pocketed the gap:
Arranger profit ≈ (yield on BBB collateral) − (weighted coupon paid to CDO investors) − (fees)
That spread was real cash, and it existed only because the ratings transformation was accepted. Turn risky collateral into mostly-safe notes and you could earn the difference between what risk pays and what safety costs, on billions of dollars of paper, over and over. The correlation assumption was not an academic detail. It was the input that manufactured the arbitrage.
Where the Risk Actually Sat: Equity, Excess Spread, and Leverage
There is one more piece worth making explicit, because it explains who was really exposed. The equity tranche at the very bottom, usually unrated, was not charity. It earned whatever survived the full trip down the waterfall, a residual the structure calls excess spread:
Excess spread = (yield on collateral) − (weighted coupon to rated tranches) − (fees) − (realized losses)
As long as the collateral performed and realized losses stayed near zero, that residual could throw off returns in the mid-teens on a thin sliver of capital. But notice the last term. Realized losses subtract directly, and they hit the equity layer first and in full before touching anyone senior. Because the equity slice was so thin relative to the pool it supported, a small rise in the pool’s loss rate could swing that residual from a healthy positive number to less than zero. The equity holder was, in effect, writing insurance against the very correlation event the senior investors had assumed away, and doing it with enormous leverage on the loss assumption. When losses were modeled as low and independent, it looked like a clever high-yield position. It was really a highly leveraged bet that the tail would never arrive.

The Agencies That Blessed It
None of this was possible without a stamp of approval, and that stamp came from Moody’s and Standard & Poor’s. This is the part I find hardest to look away from, because the failure was not subtle.
Two details tell you almost everything. The first is who did the math. According to Lewis, the agencies did not really have their own model for these CDOs. The banks sent over their own model and asked, in effect, how it looked. The party that profited from a high rating supplied the tool used to produce the rating, and the agency collected a fee per deal from that same party. The issuer pays for the grade. It’s hard to imagine designing a cleaner conflict of interest.
The second detail is what the agencies looked at. They did not examine individual loans. They evaluated the pool’s average characteristics, above all the average FICO score. That sounds like a technicality, but it opened a door that quietly broke the correlation assumption from the other side. A packager who knew the model only read the average could build a barbell pool, half very high scores and half very low, that hit the target average while loading the structure with exactly the borrowers most likely to default together. The rating measured a mean. The risk lived in the variance and the correlation. The gap between what the model scored and what the pool actually contained was, quite literally, the trade.
What stands out to me is that none of this required a villain with a master plan. It required a broker paid for volume, a lender paid for volume, a bank paid to assemble bonds, and an agency paid per deal to bless them, each optimizing a narrow incentive, none holding the risk, all leaning on a single correlation input that no one had a reason to question out loud.
Where the Story Goes Next
By the mid-2000s the machine had a voracious appetite. It needed more triple-B tranches to feed into CDOs than the mortgage market could physically originate, even with standards falling. That mismatch, more demand for subprime risk than there were subprime loans to supply, set up the next turn.
Because if the loans do not exist in sufficient quantity, the engineering will manufacture the exposure synthetically, with no homeowner and no actual mortgage involved. The tool that made that possible was the credit default swap, and the willingness to write that insurance at enormous scale came to rest, improbably, on a single insurer. That is Part 4, where credit derivatives and AIG enter the picture.
And underneath all of it sits the same parameter we just isolated: the assumption that losses would stay low and would not arrive together. Part 5 is where that assumption meets a falling national housing market, origination standards give way, and the correlation everyone modeled as low turns out to be very close to one.
For now, what I’m taking away is the shape of what we built. The tower was sliced so that senior safety was manufactured out of junior risk, and the width of that safety came down to a handful of percentage points of subordination. The unwanted risk was gathered and rebuilt into a second tower that was mostly triple-A only if you accepted one unobservable correlation number. And the whole structure was graded by agencies paid by the people whose bonds they were grading. Nobody in this had to be evil. The incentives, and one very convenient assumption, did the work.
Sources and Further Reading
This series draws on two works that, read together, tell the human story of the 2008 crisis. If you want the full account, go to the originals:
Lewis, Michael. The Big Short: Inside the Doomsday Machine. W. W. Norton, 2010.
Sorkin, Andrew Ross. Too Big to Fail. Viking, 2009.
Frequently Asked Questions about Tranches, CDOs, and the 2008 Financial Crisis
What is a tranche in a mortgage bond?
A tranche is a layer in the payment waterfall of a mortgage bond. Senior tranches are paid first and absorb losses last, earning the highest credit rating and lowest yield. Junior tranches are paid last and absorb the first losses, earning a lower rating and higher yield. The word comes from the French for slice. The structure is the same logic as a commercial real estate capital stack: senior debt, mezzanine, and equity each take a different position in the waterfall and earn a different return accordingly.
What is a CDO?
A collateralized debt obligation is a financial structure that pools a set of existing bonds or loan tranches and issues new securities backed by their cash flows. In the years before the 2008 crisis, investment banks gathered the lowest-rated (triple-B) slices of subprime mortgage bonds and assembled them into CDOs. When the rating agencies ran their models, roughly 80 percent of each CDO came out rated triple-A, despite being built entirely from the riskiest pieces of subprime bonds. The transformation relied on an assumption that those pieces would not all fail at the same time.
What is an attachment point in structured finance?
The attachment point is the level of cumulative losses in a loan pool at which a given tranche begins to suffer losses. Everything below the attachment point is absorbed by the tranches beneath it. A senior tranche with a high attachment point is protected by a thick layer of subordination. In the subprime bonds of the mid-2000s, even the lowest investment-grade tranche often had an attachment point near zero, meaning it would be wiped out once total pool losses reached roughly 7 percent. That was a very thin cushion.
What is subordination in a mortgage bond?
Subordination is the total thickness of the layers sitting below a given tranche, measured as a percentage of the pool. It is the only buffer protecting that tranche from pool losses. A triple-A rating is not a judgment on the quality of the underlying loans. It is a judgment that the subordination below the senior tranche is thick enough that losses would have to be catastrophically large before reaching it. In the subprime structures of the mid-2000s, that buffer was often just a few percentage points of the total pool.
What is default correlation and why did it matter so much?
Default correlation measures how likely it is that different loans or tranches will fail at the same time. A correlation of zero means defaults are independent and diversification works normally. A correlation of one means every default arrives together and pooling provides no protection. The rating agencies modeled the correlation among triple-B mortgage tranches at roughly 30 percent, which made a CDO built from those tranches look mostly safe. The actual correlation in a nationwide downturn was close to one, because all of the tranches were built from the same type of loan, underwritten in the same years, under the same loosening standards. When the housing market turned, they all failed together.
What is the Gaussian copula model?
The Gaussian copula is a mathematical model that describes the joint probability of multiple defaults using a single correlation parameter. Rating agencies used it to estimate the likelihood that large fractions of a CDO’s collateral would default simultaneously. The model was elegant but fragile. It was calibrated on a short window of relatively benign credit default swap spreads, not on any long history of mortgage defaults. It compressed the complex, tangled dependence among thousands of loans into one number, and that number was calibrated in conditions that bore little resemblance to a nationwide housing collapse.
Why did the rating agencies give CDOs such high ratings?
Two structural problems drove the inflated ratings. First, the agencies were paid per deal by the same banks whose bonds they were rating, creating a direct financial incentive to give favorable grades. Second, the agencies evaluated pools based on average characteristics like average FICO scores, not on the distribution or correlation of the underlying loans. A bank that understood the model could build a pool that hit the target average while concentrating the riskiest borrowers inside it. The rating measured a mean, but the risk lived in the variance and the correlation.
What is excess spread in a CDO?
Excess spread is the residual cash flow left after a CDO pays its rated noteholders, its fees, and its realized losses. The equity tranche at the bottom of the structure captures this residual. When the collateral performed well and losses were near zero, the equity position could generate returns in the mid-teens on a small amount of capital. But because the equity slice was thin relative to the pool it supported, even a modest rise in realized losses could wipe out the residual entirely. The equity holder was effectively writing highly leveraged insurance against the loss scenario the senior investors had been told was remote.
What comes next in this series?
Part 4 covers what happened when demand for subprime risk outpaced the supply of actual subprime loans. The solution was to manufacture the exposure synthetically using credit default swaps, with no homeowner or actual mortgage involved. The willingness to write that insurance at an enormous scale concentrated in one institution: AIG. Part 4 is where credit derivatives and AIG enter the story.

