

When the Other Side Stopped Paying: 2008 Crisis, Part 6
Part 6 of my series working through the 2008 financial crisis from a real estate perspective, and the part where the losses finally reach the plumbing. If you’re new to the series, in Part 1 I looked at why the mortgage was trusted, in Part 2 I followed a single mortgage payment down the chain and watched the risk detach from everyone who touched it, in Part 3 I opened up the tower of tranches and CDOs, in Part 4 I showed how the bets on that tower outgrew the mortgage market itself, and in Part 5 I traced why house prices only needed to stop rising for every loan to fail at the same moment. Here I want to follow what happened when the first large institution stopped paying, and why the financial system came closer to stopping than the losses alone can explain.
Part 5 ended on a question rather than a loss. When Lehman Brothers failed, what froze the system was not how much money had been lost. It was whether the institution on the other side of your hedge was still standing, and there was no way to find out.
Answering that question means changing the kind of assumption this series has been tracking. Through five parts, the clean equation at the center of each installment rested on an assumption about houses: that they would not all lose value at once. The assumption in this part is about something else.
It is about each other.
The Rent Roll You Already Know
Start with something every retail underwriter has modeled, because the mechanism in this part is not exotic.
Picture a shopping center that is 95 percent leased. The anchor is a grocer, and a dozen inline tenants signed their leases partly because the grocer was there. Several of those leases carry a co-tenancy clause: if the anchor goes dark, the tenant’s rent drops, or the tenant gets the right to leave. Now the grocer files for bankruptcy.
On the rent roll, you lost one tenant. In the cash flow, you lost the grocer’s rent, plus a reduction in every lease with a co-tenancy clause, plus possibly several of those tenants entirely. One failure rewrote contracts the failed tenant was never a party to.
Anyone who has underwritten retail through a downturn eventually learns the same thing. Occupancy is not cash. A building is only as leased as its tenants are solvent, and the tenants are not independent of each other.
Part 4 planted that idea in a different market. A dealer bank that had sold credit protection to one client and bought identical protection from another was running a matched book, and on paper its risk was zero. But a matched book is only matched if both counterparties pay. Every number that made the system look safe in 2008 was a net number, what I am owed minus what I owe. And every net number carried an unstated assumption: that everybody on the other side would pay.
This part is about what happened when one of them stopped.
The Asset Nobody Could Mark
Before Lehman Brothers was a story about derivatives, it was, to a degree that is easy to forget, a story about commercial real estate.
Andrew Ross Sorkin records that Mark Walsh had nearly unlimited use of Lehman’s balance sheet and used it to turn the firm into an unhedged bet on the U.S. property market, closer in spirit to a giant REIT than to an investment bank. The signature deal came at the very top of the cycle. Together with Bank of America, Lehman committed $17.1 billion in debt and $4.6 billion in bridge equity to buy Archstone-Smith, a portfolio of high-end apartment buildings. In Sorkin’s account the properties were excellent, and the price rested on projections that rents could be raised substantially. When the credit markets seized up and Lehman had the chance to walk away, Dick Fuld declined.
Anyone who read Part 5 will recognize the shape. Pro forma rents were doing the work that in-place rents could not.
On what turned out to be its last earnings call, the one that forecast a third-quarter loss of $3.9 billion, the biggest in the firm’s history, Lehman announced a plan to spin off as much as $30 billion of commercial real estate, Archstone included, into a separate entity called REI Global. The new entity would carry its assets at held-to-maturity values instead of marking them to market. Days later, when bankers from rival firms finally saw the internal numbers during the weekend rescue talks, the real estate book had been written down by an average of only 15 percent. Most of them had assumed the true decline was far larger.
What stands out to me is that the argument over those marks was never settled before it stopped mattering. Nobody outside Lehman could value the book, and nobody inside had a reason to concede a lower number. In normal times that is a negotiation. For a firm that funded itself overnight, it was a countdown. A lender who cannot value your collateral does not need to prove it is worth less. It only needs to stop lending against it.
That is the thread Part 5 left on the table. Large losses do not, by themselves, stop a financial system. What turns a loss into a failure is how the loser is funded.
Funding That Had to Be Renewed Every Morning
If you have ever had a lender cut your advance rate at a refinance, you already understand the next mechanism. You just know it by a different name.
When you refinance a property, the lender sets an advance rate. It will lend, say, 65 percent of value, and you fund the other 35 percent with equity. If at the next refinancing the lender drops that to 55 percent, you have to find the difference or sell. The asset did not change. The lender’s willingness did.
Investment banks financed a large share of their balance sheets through repurchase agreements, or repo. The bank sells a security to a lender for cash and agrees to buy it back the next day at a slightly higher price. Economically it is a secured overnight loan. The gap between what the security is worth and the cash the lender advances against it is the haircut, which is simply one minus the advance rate. Gary Gorton and Andrew Metrick illustrate it with a bond worth $100 sold for $80: the haircut is 20 percent.
The difference from your refinancing is the clock. A repo lender can reset the advance rate every morning, on the entire balance sheet at once. And because the bank has to fund the haircut with its own capital, the haircut sets a hard ceiling on how much it can hold:
Assets that can be financed = Equity ÷ h
Take the terms one at a time. Equity is the bank’s own capital, the only money that does not have to be renewed tomorrow. h is the haircut, the share of each asset’s value the lender refuses to finance. The ceiling is the inverse of the haircut, which makes it brutally nonlinear.
Run numbers through it. With $10 billion of equity, a 2 percent haircut supports $500 billion of assets. At 5 percent, $200 billion. At 20 percent, $50 billion. A move from 2 to 20 percent does not trim the balance sheet. It forces the firm to shed $450 billion of assets, into a market where every other firm faces the same arithmetic.
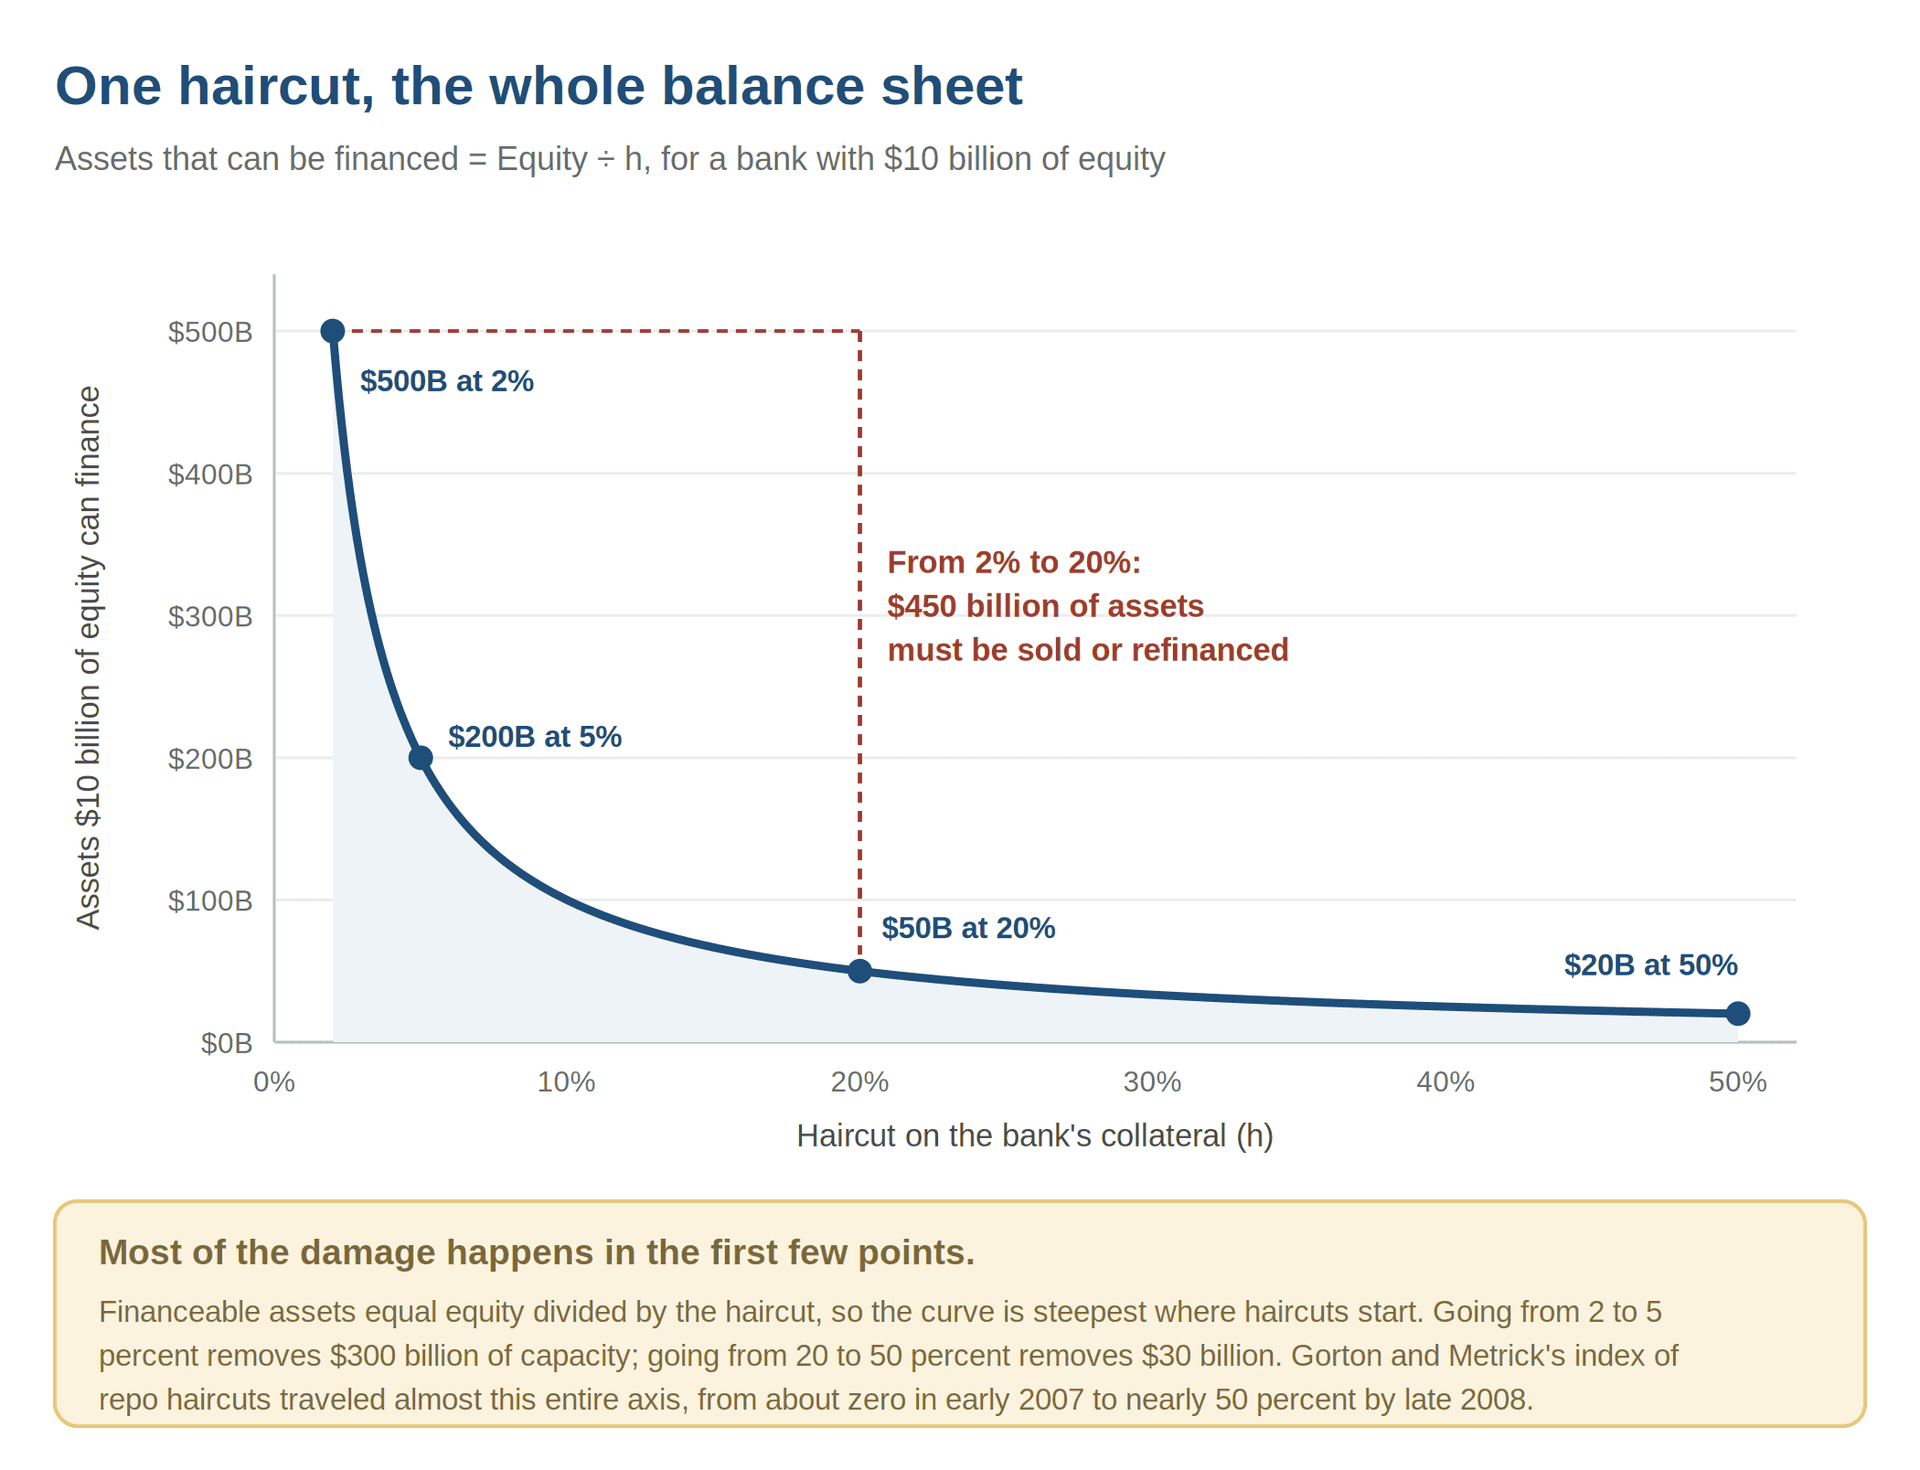
That range is not hypothetical. Gorton and Metrick built an index of repo haircuts across classes of securitized assets and found it rose from essentially zero in early 2007 to nearly 50 percent by late 2008. They read the episode as a bank run in a new venue. No lines formed outside branches. Lenders simply cut their advance rates.
Lehman lived on this funding. Michael Fleming and Asani Sarkar of the New York Fed show that its broker-dealer was financing about $80 billion through tri-party repo at the end of May 2008. By September 19, the figure was $650 million. JPMorgan, as Lehman’s clearing bank, saw those trades pass through its own systems, and Sorkin describes Jamie Dimon telling his team that weekend to prepare for the failure of Lehman and of several firms behind it.
This is the distinction the rest of the part depends on. A firm can be solvent on paper and still fail if it cannot fund itself until the market agrees it is solvent. Lehman’s assets would be argued over for years. Its funding did not wait for the verdict.
The Weekend Nobody Could Net
To see why Lehman’s failure was so hard to contain, it helps to be precise about what Lehman was to the rest of Wall Street. It was a borrower, as the last section showed. But it was also a dealer, which means it stood in the middle of other people’s trades.
Take one credit default swap of the kind Part 4 described. A hedge fund wants protection on a bond and buys it from Lehman. Lehman does not want the risk, so it buys identical protection from another bank. Lehman is now matched: whatever it owes the hedge fund, the other bank owes Lehman. The hedge fund and the bank never deal with each other. Each one’s hedge runs through Lehman. Multiply that by hundreds of thousands of contracts in credit default swaps, interest rate swaps and currency swaps, and you have Lehman’s real position in the system. It was a node at the center of a web of offsetting contracts, and the institution at the other end of each of those contracts felt hedged.
By Sunday morning, September 14, there was a plan to keep that node alive. In Sorkin’s telling, Barclays would buy Lehman if the rest of Wall Street absorbed its worst assets, and the banks gathered at the New York Fed had agreed to fund that. Then the deal died in London. The British government would not waive the shareholder vote Barclays needed, and would not take on the risk itself. Paulson told his colleagues that the British did not want to import an American problem into their own system.
With bankruptcy now certain, the New York Fed tried something that is, to me, the most revealing moment of the entire crisis. It opened an emergency two-hour trading session in New York and London, built on the logic of the example above. The hedge fund was relying on Lehman for protection, and the other bank had sold that same protection to Lehman. So the two of them could sign a new contract directly, and Lehman would no longer sit in the middle. Each would keep the hedge it thought it had. Every trade was conditional: it would take effect only if Lehman’s parent filed for bankruptcy before 9 a.m. on Monday.
It barely worked. Bill Gross of PIMCO told reporters that afternoon, as Sorkin recounts, that perhaps $1 billion had changed hands, at much wider spreads than on Friday. When traders left their desks at 4 p.m., many had as much exposure to Lehman as they had on Friday afternoon.
The reason is worth spelling out, because it is the whole problem in miniature. To replace a trade with Lehman, a bank had to find the institution holding the opposite trade with Lehman: same reference, same maturity, roughly the same size. But each bank could see only its own side. The hedge fund knew it had bought protection from Lehman. It had no way of knowing which bank had sold Lehman the offsetting contract, or whether that bank would face it directly, at a new price, on a Sunday, with a few hours on the clock. The other end of every hedge existed. Nobody could see it.
Lehman itself was no better informed. That afternoon, the New York Fed asked how much cash Lehman’s broker-dealer would need to get through Monday. One Lehman executive answered with a question about the $50 billion of trades due to settle the next day: “how many of our counterparties are going to send us the money.” The firm at the center of the web could not say whether its own matched book would be paid.
On Monday, September 15, Lehman Brothers Holdings filed for bankruptcy, and its counterparties began terminating their contracts. Michael Lewis notes that the rulebook for swaps written by the International Swaps and Derivatives Association, the same body whose contract terms Part 4 described, existed in the first place because of the fear that the other side of a trade might go bust. September 15 was that day, at a scale nobody had planned for.
Termination turns a contract into a number. The trade stops, and its current market value becomes a claim. If the contract was worth money to Lehman, the counterparty still has to pay. If it was worth money to the counterparty, the counterparty becomes an unsecured creditor of a bankrupt firm. That asymmetry is the whole of the next formula:
Loss if counterparty j fails = (Owed by j – Collateral held) x (1 – R_j)
Read it piece by piece. Owed by j is what the failed counterparty owes you when the contract is terminated, its market value on that day. Collateral held is whatever it had already posted as the contract moved in your favor, the mechanism Part 4 described with AIG, and you keep it. R_j is the recovery rate, the share of the remaining claim the bankruptcy estate eventually pays. Now look at what is missing from that expression: everything you owe to others. Your own obligations do not shrink when your counterparty fails.
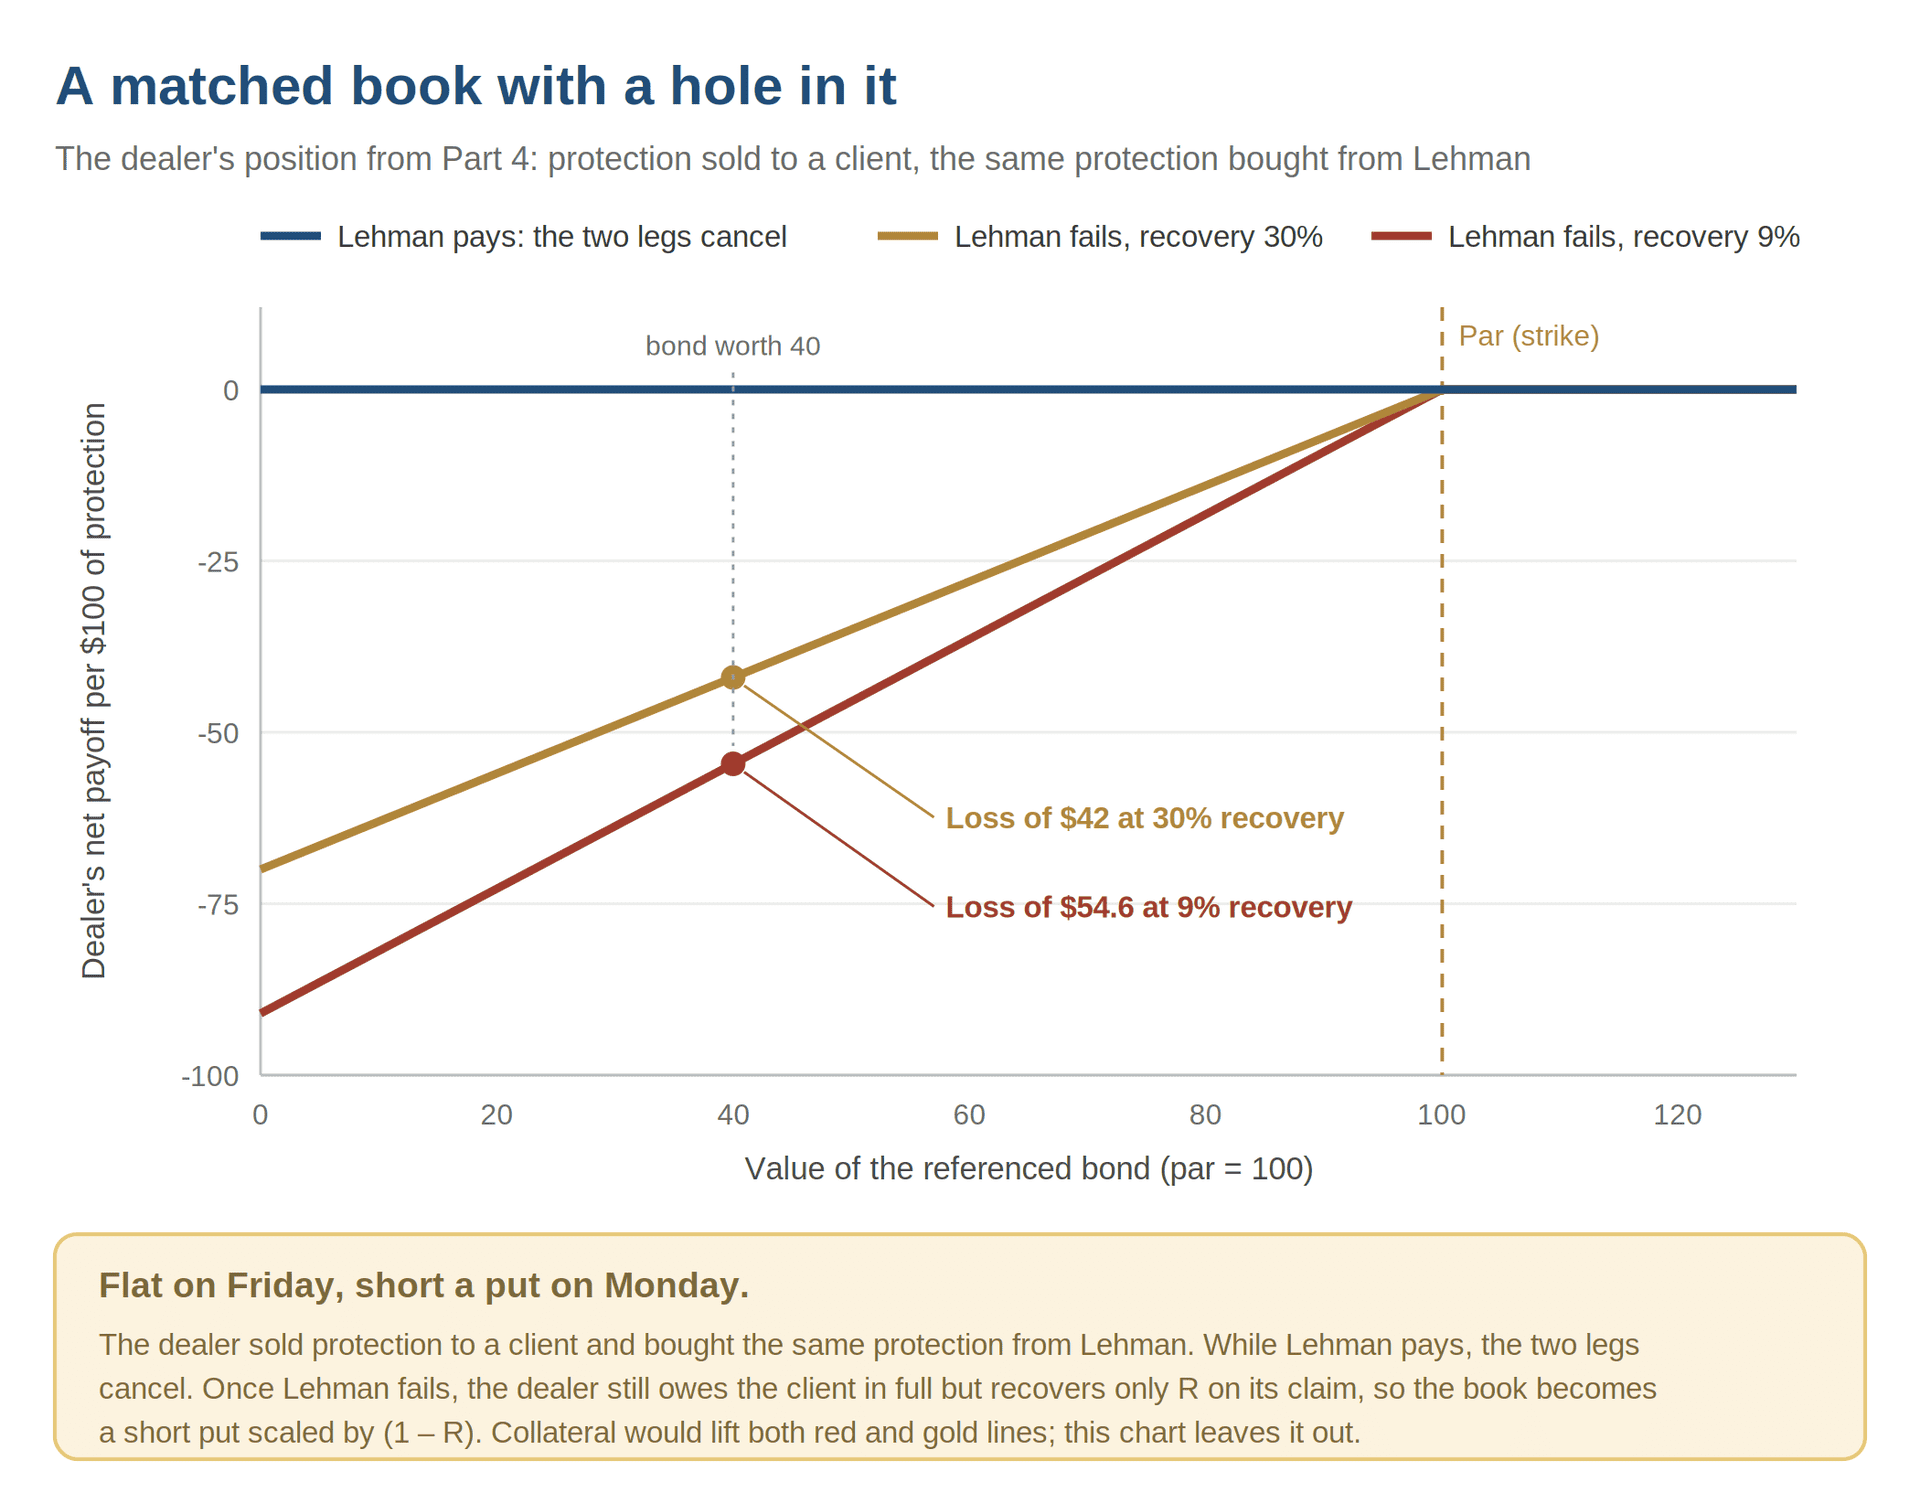
Put numbers on it with a dealer running exactly the matched book from Part 4. The dealer sold protection to a hedge fund and bought identical protection from Lehman. The referenced bond has deteriorated, so both contracts have moved. The dealer’s contract with Lehman is now worth $10 million to the dealer, and its contract with the hedge fund is worth $10 million to the hedge fund. Net position: zero. Along the way, Lehman had posted $2 million of collateral.
Lehman files. The dealer keeps the $2 million and holds an unsecured claim for the remaining $8 million. Its obligation to the hedge fund is untouched: $10 million, in full, with no protection behind it. To be hedged again, the dealer has to buy new protection from someone else at Monday’s prices.
The term nobody could fill in was R. On the day Lehman filed, the price of its senior bonds pointed to creditors getting back about 30 cents on the dollar. A month later, the market was pricing about 9 cents, and two and a half years later the estate itself expected holding-company creditors to recover 16 percent. Fleming and Sarkar later put the recovery for Lehman’s creditors at 28 percent. On the dealer’s $8 million claim, that range means a loss of $5.6 million at the first estimate and $7.3 million at the second. The dealer that was flat on Friday held, on Monday, the naked short put Part 4 warned about, with no way to know what the hole in it would cost.
Now multiply that desk by the scale of Lehman. Fleming and Sarkar count more than 900,000 derivatives contracts and 209 subsidiaries across 21 countries. Counterparties had terminated some 733,000 trades by mid-November. In some cases, they found, neither Lehman nor its counterparties were sure which Lehman subsidiary actually owed the claim. Part 4 closed on the line that nobody could work out who was standing behind whom. In Lehman’s case, sometimes not even the lawyers could.
The Run Went Where the Cash Was
The first place the panic surfaced was the one part of the financial system most people thought carried no risk at all.
Money market funds held short-term IOUs from banks and corporations and promised investors, in effect, a dollar back for every dollar in. Sorkin records that the Reserve Primary Fund had reached for the highest yield in its industry, 4.04 percent, partly by holding $785 million of Lehman’s short-term paper. When Lehman filed, that paper was worth little or nothing. On Tuesday, September 16, the fund broke the buck, and its shares were worth 97 cents. Lewis captures the shock in a single line about money market funds: “until that moment, people thought of them as cash.”
The arithmetic of why it became a run is worth slowing down for. Write down what a remaining share is worth after some investors have already left at a full dollar:
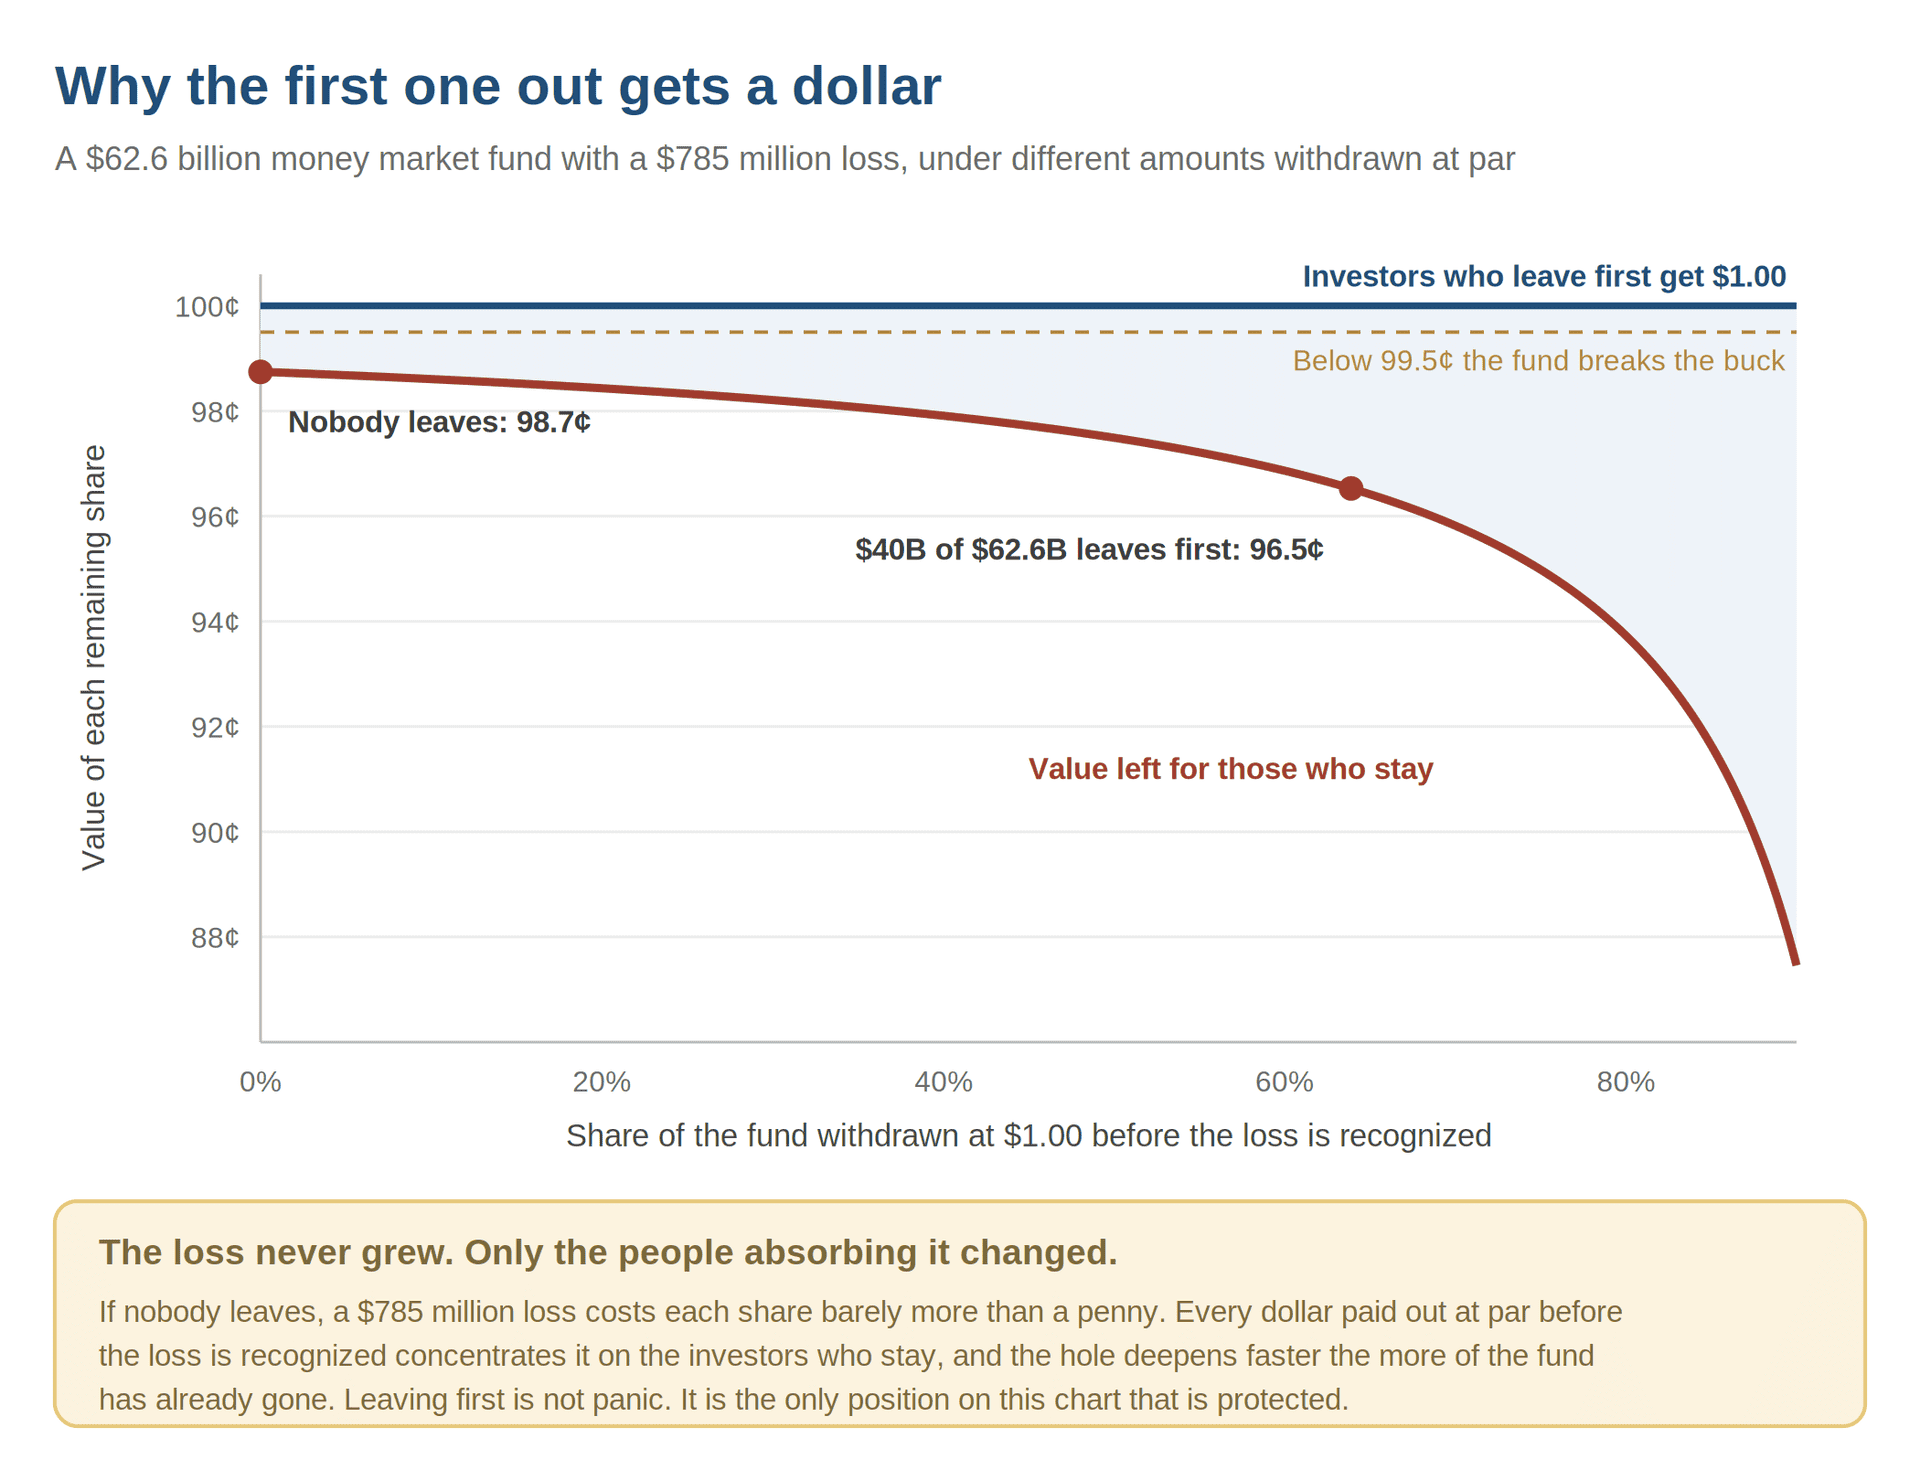
NAV of remaining shares = (A – X – L) ÷ (A – X)
A is the fund’s assets before the loss. X is what departing investors withdraw at a dollar per share. L is the loss. Sorkin puts the fund at $62.6 billion. With no withdrawals, a $785 million loss leaves (62.6 – 0.785) ÷ 62.6, or about 98.7 cents. That is already below the 99.5 cents at which a fund rounds down and breaks the buck, but it is a loss of barely more than a penny.
Now let investors leave at a dollar before the loss is recognized. If, say, $40 billion walks out at par, the same $785 million is spread over the $22.6 billion that stayed: 21.8 ÷ 22.6, or about 96.5 cents, close to where the fund ended up.
Think about what that means for an investor deciding whether to stay. The loss did not grow. What changed was who absorbed it. Every investor who left first got a full dollar, and every withdrawal made the hole deeper for those who stayed. Running was not irrational. It was the correct response to the formula, and investors in every other prime fund could do the same arithmetic about their own fund.
They did. On September 19 the Treasury announced it would guarantee money market funds. By then the retreat had reached the companies that relied on those funds. Marcin Kacperczyk and Philipp Schnabl find that financial commercial paper outstanding fell 29.5 percent, from $806 billion to $568 billion, between September 10 and October 22, 2008.
The same logic ran through prime brokerage, where hedge funds keep their cash and securities with a dealer. Lehman’s London operation went into administration, and hedge funds with accounts there could not get at their assets. They needed cash from wherever else they had it. Sorkin records that Morgan Stanley started the week with $178 billion available, and within twenty-four hours more than $20 billion had been withdrawn as hedge fund clients pulled balances or closed accounts. A client that has just watched its assets freeze at one prime broker does not wait to learn whether the next one is sound. It leaves first, because leaving first is the only way to be sure.
The Counterparty to Everyone
In Part 4 I left AIG at the point where its collateral obligations were tied to its own credit rating. Sorkin estimated that a one-notch downgrade could trigger about $10.5 billion in calls, and that a second agency following would push it to roughly $13.3 billion. That is where this section picks up.
On September 15, all three major rating agencies cut AIG below AA–. Robert McDonald and Anna Paulson reconstruct what followed: collateral calls on its credit default swaps climbed to $32 billion, and the gap between what counterparties demanded and what AIG had posted reached $12.4 billion, against $4.5 billion only three days earlier. The bankers trying to assemble a private rescue concluded that AIG needed $80 to $90 billion and had about $50 billion to work with.
Why AIG was rescued when Lehman, a day earlier, was not is still argued over. Lewis notes that the officials’ public explanation for letting Lehman fail shifted in the following months, from a deliberate signal to a lack of legal authority. I will not try to settle that debate here. But Sorkin’s account makes clear what officials were looking at on Tuesday. A list of AIG’s largest counterparties circulated at the New York Fed. ABN AMRO, by then part of Royal Bank of Scotland, headed it at $65 billion, with Goldman Sachs, Barclays and Morgan Stanley further down. European banks had used more than $300 billion of AIG’s credit default swaps to lower the capital regulators required them to hold. If AIG failed, that protection would vanish overnight, and those banks would need to raise capital at the worst possible moment.
One detail in Sorkin’s account I find especially telling. Goldman Sachs had bought credit default swaps on AIG itself, and the firm believed it might even make $50 million if AIG collapsed. Lloyd Blankfein saw the larger problem. The hedge was only as good as the institutions that had sold it, and those institutions were themselves exposed to AIG. Risk managers call this wrong-way risk: the protection is most likely to fail at exactly the moment you need it. A matched book against AIG was matched only if the sellers of protection on AIG survived AIG.
Late on September 16, the Federal Reserve agreed to lend AIG up to $85 billion. Total government support would eventually reach $182.3 billion. That November and December, AIG’s credit default swaps on multi-sector CDOs were retired through a Fed vehicle called Maiden Lane III. According to the TARP inspector general, the counterparties received $27.1 billion from that vehicle and kept $35 billion in collateral AIG had already posted, which amounted to being paid par, $62.1 billion in all.
In the end, the counterparty to everyone was replaced by the government. The alternative was finding out what every net number in the system was worth with one of its largest nodes removed.
What the $366 Billion Was Really Measuring
Part 5 ended on two numbers that describe the same contracts. One was roughly $366 billion that sellers of protection on Lehman might owe. The other was a net settlement of roughly $6 billion. Both were real numbers. They answered different questions, and the gap between them turns out to be the best way into everything this part has described. Closing that loop takes three steps: what kind of contract the numbers measured, where each number came from, and why the second could only be known after the fact.
Start with a distinction the headlines blurred. The previous sections were about contracts with Lehman, where Lehman was a party that owed or was owed money. The $366 billion was about contracts on Lehman: credit default swaps in which Lehman was only the reference name. Lehman was not a party to them at all. A buyer and a seller of protection, both somewhere else in the system, had bet on whether Lehman would default. When it did, those contracts paid out between them.
How much they paid was fixed by an industry auction on October 10, which set the recovery value of Lehman’s bonds at 8.625 cents on the dollar. That price lined up with what Lehman’s own bonds were implying a month after the filing. Every seller of protection then owed the buyer the difference between par and that recovery:
Gross payment = Notional x (1 – R)
Notional is the face amount of protection written. R is the recovery fixed at the auction. With R at 8.625 percent, sellers owed 91.375 cents for every dollar of protection sold. That is the entire origin of the $366 billion: roughly $400 billion of notional, a figure circulating in the press, multiplied by 0.91375. The formula was right. The input was a guess.
Now the net. Go back to the dealer from the weekend, but this time on a contract on Lehman instead of with it. The dealer sold $100 million of protection on Lehman to a hedge fund and bought $100 million of identical protection from another bank. After the auction, the dealer owes the hedge fund $91.375 million and is owed $91.375 million by the bank. Gross, $182.75 million of payments touch the dealer. Net, nothing. Once the two payments are offset against each other, not a dollar has to move through the dealer.
Most of the market looked like that dealer. Dealers sold protection to clients and bought it back from each other, so a large share of the gross obligations ran in circles between institutions that owed and were owed nearly the same amounts. Cash only had to move at the ends of those chains: the participants who had bought protection without selling any, and the ones who had sold without buying.
That is what the record shows happened. A large part of the market was recorded in one place, the Depository Trust & Clearing Corporation’s Trade Information Warehouse. When I wrote in Part 4 that there was no central record of these contracts, the more exact statement is that there was no public one. On October 11, nearly four weeks after the bankruptcy, DTCC disclosed that it held about $72 billion of protection on Lehman and estimated net payments of around $6 billion. When the money actually moved, on October 21, the net figure was $5.2 billion. On DTCC’s $72 billion, the gross obligation was 72 x 0.91375, or about $65.8 billion. The cash that changed hands was about 8 cents of every gross dollar. The other 92 cents canceled.
So the two numbers in Part 5 were measuring two different worlds. The $366 billion was how much money would have had to move if nothing could be offset. The $5.2 billion was how much had to move once everything was offset and every party in every circle paid. For almost four weeks, between the filing and DTCC’s disclosure, nobody outside the warehouse knew where between those two worlds the market actually sat.
I did not expect the record to point this way, but it does. The thing the market feared most about Lehman, the credit default swaps written on it, turned out to be the part that worked. It worked because, for those contracts, someone could see both sides. The warehouse knew which dealer had sold to whom and bought from whom, so the circles could be found and canceled. What broke was everything with Lehman, or AIG, on the other side: the derivatives books of the weekend, the money funds, the prime brokerage clients, the banks lined up behind AIG. Those contracts were spread across hundreds of thousands of bilateral agreements, and no single party held the map.
Why does seeing the whole map matter so much? Because a net number is the answer to a calculation that assumes everybody pays, and that calculation cannot be done one firm at a time. Larry Eisenberg and Thomas Noe formalized it in Management Science in 2001, with a rule simple enough to state in a sentence: each institution pays the smaller of what it owes and what it has.
Payment_i = min( Owed_i , Cash_i + Received_i )
Take the terms one at a time. Owed_i is what institution i is contractually due to pay. Cash_i is the money it has of its own. Received_i is what it collects from everyone who owes it, and that last term is where the difficulty lives. What i receives depends on what its debtors can pay, which depends on what they receive, which may depend on what i pays. Every payment in the system feeds into every other, so no firm can be solved in isolation. The only consistent answer is the set of payments where the rule holds for everyone at once.
A small ring shows what that means in practice. Four institutions. A owes $10 million to B and $10 million to an outside creditor, D. B owes $10 million to C. C owes $10 million to A. B and C run perfectly matched books: each is owed exactly what it owes.
If A has $20 million of its own, the ring is trivial. A pays everyone in full, B passes its $10 million on to C, C pays A, and every contract settles.
Now give A a loss that leaves it with $4 million. A can no longer pay $20 million, so it pays what it has, split in proportion to its debts: half to B and half to D. But what A “has” includes whatever flows back to it around the ring, and that depends on A’s own payment. Follow one dollar. Of every dollar A pays, half goes to D and leaves the ring. The other half goes to B, which passes it to C, which passes it back to A. So A’s total payment equals its own $4 million plus half of its own payment:
A = 4 + A ÷ 2, which gives A = $8 million
A sends $4 million to B and $4 million to D. B receives $4 million and pays C $4 million. C receives $4 million and pays A $4 million, which, together with A’s own $4 million, is exactly the $8 million A paid out. Every payment is consistent with every other.
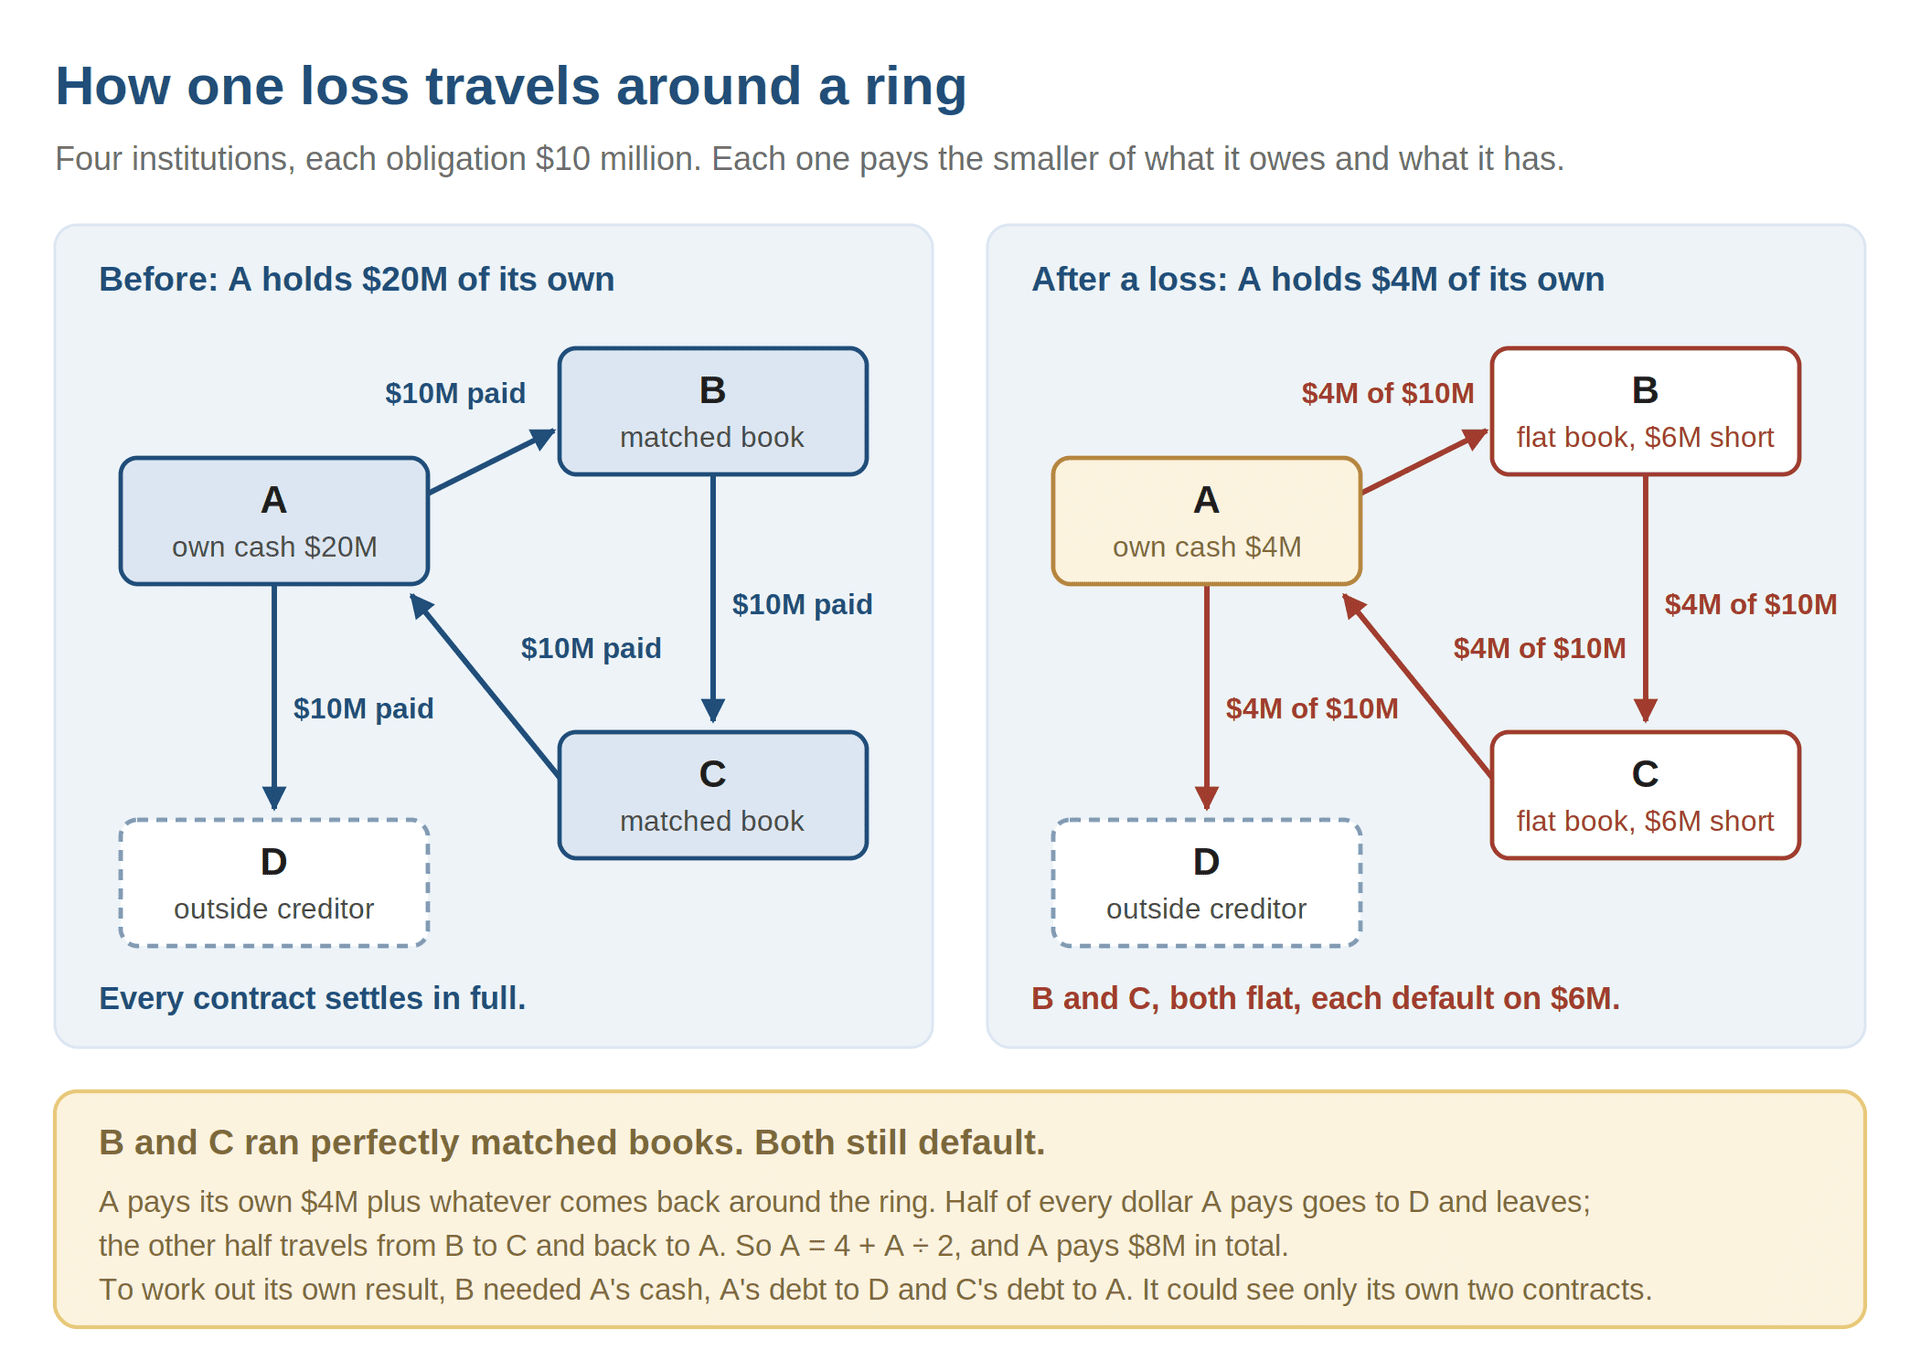
Look at where that leaves B and C. Each was owed $10 million and received $4 million. Each owed $10 million and paid $4 million. Both are in default on $6 million. Neither took a bad position. The loss started entirely at A. Notice, too, what B would have needed to know to compute its own outcome: A’s cash, A’s obligation to D, and the fact that C owed A. From its own desk, B could see two lines, what A owed it and what it owed C.
In September 2008 the ring had thousands of members. For the contracts on Lehman, a large part of the map sat in one warehouse, where the offsetting positions could be found and canceled, and everyone in those circles was still standing to pay. For the contracts with Lehman and AIG, the map was scattered across hundreds of thousands of bilateral agreements, and one member of the ring had just stopped paying. The $5.2 billion was the answer once part of the map was assembled. The $366 billion was the question everyone was asking before it was.
Where the Story Goes Next
The pattern in September 2008 repeated every time. A net number that looked safe turned out to depend on someone else paying, and when that someone failed, the obligation landed in full on whoever was next in line. The matched book, the money fund, the prime brokerage account, the banks behind AIG: each was flat, or safe, or as good as cash, right up until the other side stopped paying.
Within three weeks of Lehman’s filing, Congress had passed the Emergency Economic Stabilization Act, and on October 8 six major central banks cut interest rates together in an unprecedented coordinated move. What those measures had in common was that the state stepped in as the counterparty nobody else could be: guarantor of the money funds, lender to AIG, and soon a direct source of capital for the banks.
For now, what I’m taking away from this part is that every reassuring number in the system was a net number, and every net number assumed that everybody else would pay. Through five parts, the assumption that failed was about houses. In September 2008 it was about each other, and that kind of assumption fails faster, because the moment it is doubted, acting on the doubt is the rational thing to do.
The machinery that packaged mortgages in 2006 did not disappear, and much of it still finances commercial real estate today. The question that froze the system in 2008 is worth asking of it now: not how much the assets are worth, but who is standing on the other side, and whether they can pay.
That is Part 7, and the last in the series.
Sources and Further Reading
This series is built on two narrative accounts of the crisis, supplemented by the academic and official record. If you want the full story, go to the originals:
- Lewis, Michael. The Big Short: Inside the Doomsday Machine. W. W. Norton, 2010.
- Sorkin, Andrew Ross. Too Big to Fail. Viking, 2009.
- Bank for International Settlements. “Three Market Implications of the Lehman Bankruptcy.” BIS Quarterly Review, December 2008.
- Eisenberg, Larry, and Thomas H. Noe. “Systemic Risk in Financial Systems.” Management Science 47, no. 2 (2001): 236-249.
- Fleming, Michael J., and Asani Sarkar. “The Failure Resolution of Lehman Brothers.” Federal Reserve Bank of New York Economic Policy Review 20, no. 2 (2014): 175-206.
- Fleming, Michael J., and Asani Sarkar. “Creditor Recovery in Lehman’s Bankruptcy.” Liberty Street Economics, Federal Reserve Bank of New York, January 14, 2019.
- Gorton, Gary, and Andrew Metrick. “Securitized Banking and the Run on Repo.” Journal of Financial Economics 104, no. 3 (2012): 425-451.
- Kacperczyk, Marcin, and Philipp Schnabl. “When Safe Proved Risky: Commercial Paper during the Financial Crisis of 2007-2009.” Journal of Economic Perspectives 24, no. 1 (2010).
- McDonald, Robert, and Anna Paulson. “AIG in Hindsight.” Journal of Economic Perspectives 29, no. 2 (2015): 81-106.
- Office of the Special Inspector General for the Troubled Asset Relief Program. Factors Affecting Efforts to Limit Payments to AIG Counterparties (SIGTARP-10-003). November 17, 2009.
Frequently Asked Questions about Lehman Brothers, Counterparty Risk, and the 2008 Financial Crisis
What was Lehman Brothers and why did it fail?
Lehman Brothers was a major investment bank that had transformed its balance sheet into an unhedged bet on U.S. commercial real estate, particularly through its $17.1 billion debt commitment to acquire the Archstone-Smith apartment portfolio. When the credit markets seized, the value of those real estate assets could not be agreed upon, and because Lehman funded a large share of its balance sheet through overnight repurchase agreements that had to be renewed daily, lenders stopped advancing against its collateral before any market verdict was reached. The firm that was solvent on paper could not fund itself through Monday morning.
What is a repo haircut and how did it trigger the crisis?
A repurchase agreement, or repo, is an overnight secured loan in which a bank sells a security and agrees to buy it back the next day. The haircut is the gap between the security’s value and the cash the lender will advance against it. With $10 billion of equity, a 2 percent haircut supports $500 billion of assets; at 20 percent it supports only $50 billion. Gorton and Metrick show that repo haircuts across securitized assets rose from essentially zero in early 2007 to nearly 50 percent by late 2008. That is not a haircut trim. It is a forced liquidation of hundreds of billions of dollars of assets, simultaneously, across every firm in the market.
What is counterparty risk?
Counterparty risk is the risk that the other party to a financial contract fails to pay. In 2008 it mattered because every net number that made the system look safe assumed that everybody on the other side would pay. A dealer running a matched book, a fund holding a hedge, a bank relying on AIG protection: each was neutral on paper, and each was neutral only if the counterparty performed. When Lehman failed, every institution that had hedged through it held a naked position it had not meant to own, and had to find out, without a central record, what the hole would cost.
What was the matched book problem during the Lehman failure?
A dealer running a matched book had sold protection to one client and bought identical protection from another, with the two legs canceling on paper. When Lehman filed, everyone who had hedged through it needed to replace their trade. The New York Fed opened an emergency session to allow counterparties to net directly with each other and cut Lehman out. It barely worked because each firm could see only its own side of the trade. The hedge fund knew it had bought protection from Lehman but had no way of knowing which bank held the offsetting contract or whether that bank would face it directly at Sunday prices. The other end of every hedge existed. Nobody could see it.
Why did money market funds break the buck in 2008?
The Reserve Primary Fund held $785 million of Lehman’s short-term debt, which became nearly worthless when Lehman filed. The loss itself was small relative to the fund’s $62.6 billion in assets, about 1.25 cents per share before withdrawals. But once investors began redeeming at par before the loss was recognized, those who stayed absorbed a growing share of a fixed loss. Each early withdrawal made the shortfall deeper for those remaining. Running was not irrational: it was the correct response to the math, and investors in every other prime fund could do the same arithmetic about their own fund. The Treasury announced a guarantee of money market funds three days later.
Why was AIG rescued but Lehman was not?
The official explanations for letting Lehman fail shifted over time, and the debate is still ongoing. What Sorkin’s account makes clear is what officials saw when they looked at AIG. A list of AIG’s largest counterparties circulated at the New York Fed showed ABN AMRO at $65 billion with Goldman Sachs, Barclays and Morgan Stanley behind it. European banks had used more than $300 billion of AIG’s credit protection to reduce the regulatory capital they were required to hold. If AIG failed, that protection would disappear overnight and those banks would need to raise capital at the worst possible moment. The Federal Reserve agreed to lend AIG up to $85 billion on September 16, and total government support eventually reached $182.3 billion.
What is wrong-way risk?
Wrong-way risk is the situation in which a hedge is most likely to fail at exactly the moment you need it. Goldman Sachs had bought credit default swaps on AIG itself, meaning Goldman stood to collect if AIG collapsed. Lloyd Blankfein saw the larger problem: the institutions that had sold Goldman that protection were themselves exposed to AIG. If AIG failed, those sellers might fail too, and Goldman’s hedge on AIG would vanish alongside the thing it was hedging. A matched book against AIG was only matched if the sellers of protection on AIG survived AIG failing.
What was the difference between the $366 billion and the $5.2 billion Lehman settlement?
The $366 billion was the gross amount that would have had to move if every credit default swap referencing Lehman settled independently, with no offsetting positions netted against each other. The $5.2 billion was the cash that actually moved once the Depository Trust and Clearing Corporation identified which dealers were on both sides of the same trades and canceled the offsetting positions. Most of the market looked like a dealer who had sold $100 million of protection and bought $100 million of identical protection: gross, $200 million would touch them; net, nothing. For almost four weeks after the bankruptcy filing, nobody outside the DTCC warehouse knew where between those two numbers the market actually sat.
What is the Eisenberg-Noe formula and what does it show about systemic risk?
Eisenberg and Noe formalized a simple rule: each institution pays the smaller of what it owes and what it has, where what it has includes both its own cash and what it receives from others who owe it. Because what any institution receives depends on what its debtors can pay, which depends on what they receive, every payment in the system feeds into every other. No firm’s outcome can be solved in isolation. A loss at one node propagates through the network in ways that perfectly matched books cannot see from their own desks, because each firm knows only its own two sides of the web, not the full ring of obligations connecting it to every other institution. In September 2008, the ring had thousands of members and no single party held the map.
What comes next in this series?
Part 7 is the last in the series. It will look at what the 2008 crisis left behind for the professionals who underwrite and finance commercial real estate today. The machinery that packaged mortgages in 2006 did not disappear. Much of it still finances commercial real estate. Part 7 asks the question the crisis teaches us to ask: not how much the assets are worth, but who is standing on the other side, and whether they can pay.
