S-Curve Forecasting in Real Estate Development (Updated June 2026)
One of the reasons Michael and I blog, is to force ourselves to be continually learning. I built the first version of my real estate waterfall model, because I wanted to better understand the mechanics of modeling an equity waterfall with IRR hurdles. Michael started his Understanding Leases Series, because there were nuances of modeling complicated (and less complicated) lease provisions that he wanted to understand better. Most of the ideas for my posts come from a curiosity to understand the why and how behind the things we do in commercial real estate.
Note: This post was originally written in 2015. The model has since been updated several times, but the commentary remains from 2015.
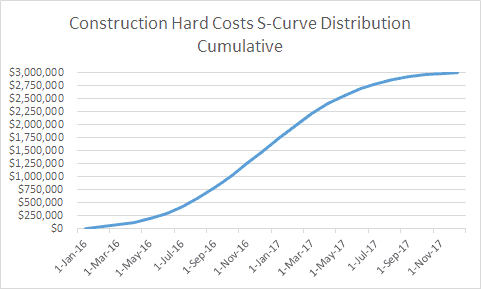
Cumulative Project Hard Costs – S-Curve
One concept I’ve wanted to explore deeper, is the concept of using the s-curve (sigmoid growth curve) to forecast development/project cash flows. Now I’d seen this used professionally, but had never built a model with an s-curve before and didn’t entirely understand the formulas behind this method of distributing cash flows. So I set out to build a basic real estate development cash flow model that incorporated this concept.
You might also check out my Construction Draw and Interest Calculation Model
What is the S-Curve Method?
If you’re unfamiliar with modeling development cash flows using an s-curve, the concept is simple. Most project costs are not spent linearly (or straight-line). You typically start by spending less per period in the earlier months while you’re ramping up construction, spend more per period in the middle months when construction is humming along, and then less per period in the latter months as construction winds down. The result, if you graph the cumulative cash outflows, looks like an ‘S’ tipped on its side. And interestingly enough, if you graph the cash flows by period, the resulting graph is a normal distribution (think back to your statistics courses in college).
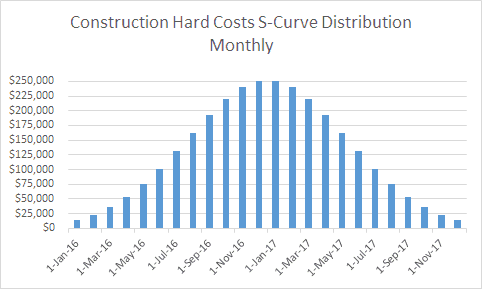
Project Hard Costs per Period – Normal Distribution Curve
Knowing what I wanted, but not entirely sure of how to accomplish it, I opened up Excel and plunked out a basic layout with inputs. The inputs would be 1) Budget Item, 2) Amount Per Item, 3) Cash Flow Distribution Method (Straight-line, S-Curve, and Manual Input), 4) Start Month (when cash flows for each budget item begin), and 5) Length (how many months cash flows will occur for each budget item). I would also later add an Analysis Start Date and an “S-Curve Distribution” input to change the steepness (i.e. standard deviation) of the normal distribution curve. I then laid out the cash flow periods, and wrote conditional formatting formulas and logic statements to model the “Straight-Line” and “Manual Input” options for the “Cash Flow Distribution Method.”
With the easy part done, I turned to the S-Curve formula. I had a few ideas of how to do this, but as I often do and to avoid reinventing the wheel, I opened up a browser window and went to Google. I wasn’t entirely sure what to look for, so I began searching different keywords and phrases related to s-curve, real estate, and development. I found an Excel add-in that models an S-curve, numerous academic discussions on the sigmoid growth curve, and a few forums where people were asking how to do exactly what I wanted to do but with few satisfactory responses. Then, I came across a post from Ben Bulloch on MrExcel.com. Ben had come up with a very good normally-distributed s-curve generation formula for spreading project costs over a number of months – it was exactly what I was looking for.
Watch the S-Curve Tutorial and Download the Excel Model
With a few tweaks, I was able to incorporate Ben’s formula and thus, complete my basic development budget cash flow distribution model using the s-curve method. I’ve recorded a video that guides you through using the model, as well as how to expand the number of budget items to fit your specific project. You’ll find below, a link to download the model for yourself.
Note: This was recorded in 2015 – so please excuse the poor audio quality! Also, the model has been improved some since it was originally released, but the core components remain the same.
Download the Construction Draw Forecasting Module with S-Curve Module
To make this model accessible to everyone, it is offered on a “Pay What You’re Able” basis with no minimum (enter $0 if you’d like) or maximum (your support helps keep the content coming – typical real estate Excel modules sell for $100 – $300+ per license). Just enter a price together with an email address to send the download link to, and then click ‘Continue’. If you have any questions about our “Pay What You’re Able” program or why we offer our models on this basis, please reach out to either Michael or Spencer.
We regularly update the model (see version notes). Paid contributors to the model receive a new download link via email each time the model is updated.
Frequently Asked Questions about S-Curve Forecasting in Real Estate Development
Version Notes
v2.3
- Placeholder value updates
v2.1
- Fixed issue where ‘Hard Costs S-Curve Cumulative’ graph was not pulling from the wrong line, and therefore was not illustrating the S-Curve
- Renamed ‘Hard Costs – Cumulative’ line to ‘Hard Costs (S-Curve) – Cumulative’
- Small formatting changes to the graphs
v2.1
- Converted S-Curve formula to use numeric periods, rather than date periods; make integration into separate models much easier
- Updated Error Check formula to use ROUND() function to eliminate false-error results due to Excel’s 15 decimal limit
- Time zero date now ends as of Analysis Start
v2.0
- Added main header
- Added ‘Month’ in-cell label to date/period headers
- Combined three tabs in one, to make adding new line items easier
- Added time zero logic
- Updated S-Curve column charts to pull from S-Curve range
- Renamed worksheet to ‘Construction CF’
- Removed $USD symbol to accommodate non-US users
- Added a ‘Total Construction Costs by Period’ colum chart
- Removed ‘Length’ input; replaced with Start/End Month logic
- Misc. formatting enhancements
v1.0
- Initial release


