• Link to Facebook
  • Link to Youtube
  • Link to LinkedIn
  • Link to X
  • Link to Tiktok
  • Link to Instagram
  • EN ESPAÑOL
    • Inicio
    • Glosario de Términos
    • Modelos Financieros
    • Tutoriales Cortos
  • A.CRE HELP
    • Support Section
    • Contact Us
  • LOGIN/REGISTER
  • Shopping Cart Shopping Cart
    0Shopping Cart
Adventures in CRE
  • A.CRE
    • A.CRE Home
    • A.CRE Help
    • Accelerator
      • Learn More
      • Login
    • AI.Edge
      • Learn More
      • Login
    • Artificial Intelligence
    • Careers
    • CRE Event Calendar
    • CRE Job Board
    • Education
    • Library of Excel Models
    • Meet the A.CRE Team
  • RE Modeling
    • 1031 Exchange
    • Audio Series
    • All-in-One (Ai1) Model
      • Download
      • Guides and Tutorials
      • Support
    • Ask Me Anything (Live)
    • Beginner’s Guide to Excel
    • Excel Models
      • Excel Add-ins
      • Library of Excel Models
      • All-in-One (Ai1) Model
      • Apartment
      • Condo
      • Debt
      • Development
      • Equity Waterfall
      • Hotel
      • Industrial
      • Office
      • Portfolio
      • Retail
      • Single Family
      • Tutorial
    • Excel Tips
    • Practice Library of Case Studies
    • Stochastic Modeling
    • Argus
    • My Downloads / My Account
  • Careers
    • About Careers in Real Estate
    • Ask Me Anything (Live)
    • Audio Series
    • Compensation in Real Estate
    • CRE Job Board
      • Find a Job
        • Browse Jobs
        • Post a Resume
        • Register
        • Login
      • Post a Job
    • CRE Event Calendar
    • CRE Interviews
    • Day in the Life Series
    • Real Estate Legal Content
    • What CRE Pros Do
  • Education
    • Accelerator
    • AI.Edge
    • A.CRE 101
    • Ask Me Anything (Live)
    • A.CRE Audio Series
    • Audio Series
    • Book Reviews
    • CRE Event Calendar
    • Deep Dive Series
    • Glossary of CRE Terms
    • Real Estate Legal Content
    • Real Estate Clubs
    • University Profiles
    • Watch Me Build
  • AI
    • AI Skills
    • AI Use Cases in CRE
    • AI for CRE Training
    • AI Tools for CRE
    • AI.Edge Membership
      • Learn More
      • Login
  • Accelerator
    • Accelerator Reviews
    • Accelerator Story
    • Enroll Now
    • Learn More
    • See What’s New
    • Enterprise Members Only
      • General Enterprise Login
      • ICSC Login
      • M&M Login
    • Members Only
      • Extend/Renew Membership
      • Login
      • Manage Membership
  • My Downloads
    • View My Downloads
    • Find an Excel Model
    • Register
    • Login
  • Click to open the search input field Click to open the search input field Search
  • Menu Menu
You are here: Home1 / Real Estate Financial Modeling2 / Excel Tips3 / Create a Dynamic Real Estate Chart in Excel
Spencer Burton
Real Estate Financial Modeling, Excel Tips, Excel Models, Tutorial

Create a Dynamic Real Estate Chart in Excel

Most of the real estate financial models we’ve shared over the years are dynamic to analysis period. Meaning, we’ve included an input to adjust the length of the analysis period, and the model will adjust the results accordingly.

This is a helpful feature to sensitive returns relative to exit, but presents some complications from a technical modeling standpoint. One of these complications is, what happens to charts or graphs you’ve created when the analysis length changes. In this tutorial, I’ll show you how to make your charts or graphs in Excel dynamic to inputs such as hold period.

Examples of Dynamic Charts in Real Estate Models

I typically build my models to be fully dynamic to changes in the analysis period (i.e. hold period).  This functionality, though, means that charts that are set for a specific hold period (say 10 years) do not work correctly when the hold period changes. To remedy this issue, I create dynamic charts using named ranges and the OFFSET() function, which automatically adjust the data they display as the analysis period input changes.

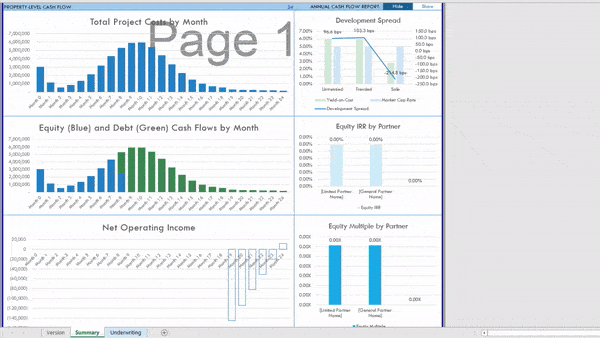
I have quite a few examples of this in our Library of Real Estate Excel models. Of particular note are the three charts used in the Summary tab of my Apartment Development Model (see GIF above). I also have included dynamic sources and uses charts in both my All-in-One model and my Construction Draw and Interest Calculation Module.

And if you’re a member of our A.CRE Real Estate Financial Modeling training program, you’ll find a dynamic chart in course ‘9. Building an Acquisitions Model from Scratch’. While the model we build together in that course isn’t entirely dynamic to hold period, I created the chart on the Summary tab to be dynamic to analysis period.

How it Works – Using Dynamic Named Ranges in Excel Charts

I’ll let the video provide more detailed step-by-step instructions, but to summarize the process.

  1. I first create a dynamic named range for the data I want to display. This involves using the OFFSET function and the Name Manager (if you recall, I did a similar post a few years back on creating dynamic lists using named ranges together with data validation).
  2. I then drop in a chart, such as a column chart, into my workbook.
  3. Next, I go into chart tools and change the data source to the named ranges I just created.
  4. The end result, is a chart that dynamically re-formats/redisplays the information as the data/inputs change.

Video Tutorial – Dynamic Charts in Excel – Real Estate Edition

In the following video, I walk you through the process of creating dynamic charts in Excel for real estate financial modeling.

Quirk with this Method

I’ve found one issue with this method. If there is an error in any of the cells within the named ranges, Excel displays an annoying alert each time the named ranges update; I first discovered this issue while creating my All-in-One Model.

The solution I came up with, is to include an IFERROR function in each of the cells that instructs the cell to be empty {=IFERROR(FORMULA,””)} if the formula it is calculating has an error.

I’m sure there are other ways of building dynamic charts or tackling the named range error. If you have one, I’d love to see or hear about it. And as always, feel free to reach out with any questions, comments, or requests you may.


Frequently Asked Questions about Creating Dynamic Real Estate Charts in Excel

What is a dynamic chart in Excel for real estate modeling?

A dynamic chart in Excel adjusts automatically based on inputs such as the analysis or hold period. It updates the displayed data and structure without needing manual reconfiguration when those inputs change.

Why are dynamic charts useful in real estate models?

Dynamic charts ensure visual data outputs remain accurate even when users change inputs like the hold period. This is especially helpful when analyzing different investment timelines or running sensitivity scenarios.

How do you create a dynamic chart in Excel?

The process involves:

Creating a dynamic named range using the OFFSET() function.

Inserting a chart (e.g., column chart).

Updating the chart’s data source to the named range via the Select Data dialog.
The chart will then respond to changes in the input range size.

What Excel function is used to build dynamic named ranges?

The OFFSET() function is used to define dynamic named ranges that grow or shrink based on inputs like the analysis period.

Where can I see examples of dynamic charts in action?

Examples are found in:

The Summary tab of the Apartment Development Model

The All-in-One Model

The Construction Draw and Interest Calculation Module

Course 9 of the A.CRE Financial Modeling program

What issue might arise when using this method?

If any cell in the named range contains an error, Excel may show an alert each time the range updates. This can be disruptive when using the chart.

How can I prevent errors from affecting dynamic charts?

Wrap your formulas in an IFERROR() function like this: =IFERROR(FORMULA,””). This ensures that any errors return a blank instead of disrupting the chart update.

Can I use this technique in any Excel version?

This method works in Excel 2013, Excel 2016, and Excel 365, as noted in the tutorial context and related models.


About the Author: Spencer Burton is Co-Founder and CEO of CRE Agents, an AI-powered platform training digital coworkers for commercial real estate. He has 20+ years of CRE experience and has underwritten over $30 billion in real estate across top institutional firms.

Spencer also co-founded Adventures in CRE, served as President at Stablewood, and holds a BS in International Affairs from Florida State University and a Masters in Real Estate Finance from Cornell University.

Contact Spencer
by Spencer Burton
Share this entry
  • Share on X
  • Share on LinkedIn
  • Share by Mail
  • Link to Instagram
  • Link to Youtube
https://www.adventuresincre.com/wp-content/uploads/2015/11/dynamic-real-estate-charts.jpg 521 711 Spencer Burton https://adventuresincre.com/wp-content/uploads/2022/04/logo-transparent-black-e1649023554691.png Spencer Burton2019-03-10 20:37:492025-07-17 18:52:33Create a Dynamic Real Estate Chart in Excel
You might also like
Supercharge Excel with the WST Macros Add-in
Using Boolean Logic to Model Multiple Generations of Tenant Improvements
A.CRE 101 – Create Smart Drop-Down Menus in Real Estate Modeling
Tutorial on How to Model Irregular Growth Rates in Real Estate
How to Use the Apartment Acquisition Model’s Monte Carlo Simulation Module
Excel Tip: Copy Worksheets between Identical Models (Updated Mar 2023)
Accelerator - Learn More

Featured Content

  • RE Financial Modeling Training
  • Library of Excel Models
  • Post a Job – It’s Free
  • Master Financial Modeling
  • Technical Interview Guide
  • Definitive Guide to Excel
A.CRE Library of Excel Models

Recent Posts

  • A.CRE Real Estate Financial Models Download Guide (Updated Jun 2026)
  • Episodio 3 de Multiplicadores: La Brecha de la IA Ya Está Aquí
  • Nuevo Contenido en Español (Actualizado Junio 2026)
  • An AI Skill for the A.CRE Short-Term Rental Acquisition Model
  • Short-Term Rental Acquisition Model (Updated June 2026)

Note About Models

Models downloaded from A.CRE may contain errors. Verify formulas/methodology before basing investment decisions on any model here. Read our Terms and Conditions of Use and Disclaimer.

★★★★★

Accelerator Reviews

Search Adventures in CRE

Search Search

Have a Question or Need Help?

Visit our Help Section

Contact Adventures in CRE

  • Visit A.CRE Help
  • Via Email
  • Via LinkedIn

You Might Also Like

  • Real Estate Modeling Courses
  • Real Estate Financial Modeling
  • A.CRE Job Board
  • Careers in Commercial Real Estate
  • Real Estate Education

A.CRE Library of Excel Models

  • Browse Excel Models
  • Login/Register
  • View My Downloads
  • Edit Account Details

Terms, Policies, and Disclaimer

  • Privacy Policy
  • Cookie Policy
  • AI Usage Policy
  • Terms of Use
  • Disclaimer
© 2014 - Present - Copyright - www.AdventuresinCRE.com, LLC | Adventures in CRE | A.CRE
  • Link to Facebook
  • Link to Youtube
  • Link to LinkedIn
  • Link to X
  • Link to Tiktok
  • Link to Instagram
Link to: Quick Tutorial: Add Line Items to OpSt Sheet in All-in-One Link to: Quick Tutorial: Add Line Items to OpSt Sheet in All-in-One Quick Tutorial: Add Line Items to OpSt Sheet in All-in-One Link to: A.CRE 101 – Create Smart Drop-Down Menus in Real Estate Modeling Link to: A.CRE 101 – Create Smart Drop-Down Menus in Real Estate Modeling A.CRE 101 – Create Smart Drop-Down Menus in Real Estate Modeling
Scroll to top Scroll to top Scroll to top