

What the Crisis Left Behind: 2008 Crisis, Part 7
Part 7 of my series working through the 2008 financial crisis from a real estate perspective, and the part where the story comes back to commercial real estate. If you’re new to the series, in Part 1 I looked at why the mortgage was trusted, in Part 2 I followed a single mortgage payment down the chain and watched the risk detach from everyone who touched it, in Part 3 I opened up the tower of tranches and CDOs, in Part 4 I showed how the bets on that tower outgrew the mortgage market itself, in Part 5 I traced why house prices only needed to stop rising for every loan to fail at the same moment, and in Part 6 I followed what happened when the first large institution stopped paying. Here I want to follow what came after the panic: who got rescued, who paid, how commercial real estate came through it, and what the rescue itself taught the market to assume.
Part 6 ended with the state stepping in as the counterparty nobody else could be: guarantor of the money funds, lender to AIG, and soon a direct source of capital for the banks. This part picks up on the afternoon that last promise was kept and follows it forward eighteen years, to the commercial real estate loans coming due right now.
Every part of this series has been built around a hidden assumption. Through five parts it was about houses: that they would not all lose value at once. In Part 6 it was about each other: that everybody on the other side would pay. The one in this part works differently, because nobody brought it into the crisis. The crisis is where it came from.
It is the assumption that the exit always comes back.
Nine Chairs Around the Table
On Monday, October 13, 2008, Columbus Day, the chief executives of the nine largest financial institutions in the United States walked into the Treasury Building without having been told why. Andrew Ross Sorkin reconstructs that afternoon in the last chapter of Too Big to Fail. The nine sat around a twenty-four-foot mahogany table, in alphabetical order behind name placards, across from Treasury Secretary Hank Paulson, Fed Chairman Ben Bernanke, New York Fed President Tim Geithner and FDIC Chair Sheila Bair.
Paulson kept it short. Treasury would use its new TARP authority to buy up to $250 billion of preferred stock in banks, all nine of them would take part, and the terms would be identical for everyone. Then Geithner read out the amounts. Treasury’s own transaction report, issued at the end of that month, lists them: $25 billion each for Citigroup, JPMorgan Chase and Wells Fargo, $25 billion between Bank of America and Merrill Lynch, $10 billion each for Goldman Sachs and Morgan Stanley, $3 billion for Bank of New York Mellon and $2 billion for State Street. In all, $125 billion.
Not everyone took it well. Dick Kovacevich of Wells Fargo wanted to know why a bank that didn’t need the money was sitting in a room about bailing out New York firms. In Sorkin’s account, Paulson stared him down, with the comptroller of the currency and the head of the FDIC seated directly across the table: “Your regulator is sitting right there.” John Mack signed for Morgan Stanley on the spot, without consulting his board, and left it to Geithner to write in the firm’s name. Jamie Dimon called his directors from a corner of the room and told them the deal was lopsided against JPMorgan, since it would help weaker banks catch up, but that they should not stand in the way. By 6:25 that evening all nine had signed. Sorkin’s verdict is that, that afternoon, the government had effectively nationalized the American financial system.
If you have ever worked a distressed deal, you know the instrument Paulson was using. It was rescue preferred equity, a senior slice of capital dropped into the stack ahead of the common and paying a fixed return. What was unusual is that he put it into nine capital stacks at once, including stacks that did not need it, and that was the point. If only the weak banks took the money, taking it would mark them as weak, and the run from Part 6 would simply move over to them. Making the strong banks take it too meant nobody could tell who actually needed it. Part 6 described a system that froze because nobody could see who was standing behind whom. On Columbus Day, Washington used that same blindness on purpose.
It did not settle everything. Within six weeks Citigroup, one of the nine institutions presented that day as healthy, was back for another $20 billion and a federal guarantee on $306 billion of its assets, as both Sorkin and Michael Lewis recount. But the money that went to the banks did come back. When TARP formally closed in September 2023, the Government Accountability Office’s final accounting showed $443.5 billion disbursed and a lifetime cost of $31.1 billion. The bank capital program that started at that table put $204.9 billion into 707 institutions and ended with a net gain of $16.3 billion.
So whatever TARP cost, the banks were not where the cost came from. Where it actually landed is the next part of the story.

Who Got Saved, and Who Didn’t
Start with AIG, which has been running through this series since Part 4. Part 6 left it on September 16, 2008, with an $85 billion line from the Federal Reserve and its counterparties about to be made whole. Total government support would eventually reach $182.3 billion.
Sorkin’s epilogue picks it up from the moment public opinion turned. More than a quarter of the rescue money left AIG almost immediately and went to the banks it owed under its credit default swaps and its securities lending program, and Goldman Sachs was the largest single recipient, at $12.9 billion. Then, in early 2009, came the reports of bonuses for AIG executives. Protesters showed up at the company’s headquarters and outside its officials’ homes, and President Obama asked publicly how the company could justify them to the taxpayers keeping it afloat. Edward Liddy, the chief executive the government had installed, was gone within eleven months.
The money came back anyway, slowly. AIG sold off businesses and repaid the Fed, and Treasury sold its shares in a series of offerings. On December 14, 2012, Treasury announced it no longer owned a single share of AIG, down from 1.655 billion in January 2011, with the last of them sold at $32.50. Its accounting put the combined Fed and Treasury commitment at $182.3 billion and the positive return at $22.7 billion. The rescue the public hated most ended up making money.
This is the detail that surprised me most. In the GAO’s breakdown, TARP’s housing programs assisted more than 3.3 million homeowners at a final cost of $31.4 billion, which is more than the lifetime cost of the whole program. The banks paid back with a profit, and so did AIG. What cost money was helping homeowners.
And the help reached fewer of them than promised. HAMP, the flagship modification program, was announced with a goal of three to four million homeowners. Treasury’s final reports count about 1.74 million permanent modifications started. CoreLogic counts approximately 7.8 million completed foreclosures from the start of 2007. The S&P CoreLogic Case-Shiller national index fell 27.4% from its July 2006 peak to its February 2012 low, and did not set a new high until the data for September 2016, a decade after the old one.
Michael Lewis saw this coming from an odd angle. In the epilogue to The Big Short, he writes that once Cornwall Capital had bet against subprime, what worried Charlie Ledley most was that the government might step in to keep individual borrowers from failing. It never did. It stepped in for the firms instead. Lewis also notes that nearly all the important players, winners and losers alike, walked away wealthy, including the chief executives whose firms either went bankrupt or were kept out of bankruptcy by Washington. His verdict on Lehman is the sharpest line in that epilogue: “The problem was that Lehman Brothers had been allowed to succeed.” As I read it, he means the bankruptcy was not the real failure. The failure was the years of reward that came before it.
And who went to prison? Almost nobody from Wall Street. Kareem Serageldin, a managing director at Credit Suisse, was sentenced in November 2013 to 30 months for hiding more than $100 million of losses in a mortgage bond trading book by inflating the prices of the bonds in it. A University of Chicago Law Review essay calls him the only banker jailed in the United States for a role in the crash. The long sentences went to mortgage fraud instead: Lee Farkas, chairman of the lender Taylor, Bean & Whitaker, got 30 years in 2011 for a fraud of more than $2.9 billion. Angelo Mozilo of Countrywide paid $67.5 million to settle SEC charges. The institutions paid through settlements with the Justice Department over mortgage securities: $16.65 billion from Bank of America, $13 billion from JPMorgan, $7 billion from Citigroup, $5.06 billion from Goldman Sachs and $2.6 billion from Morgan Stanley.
Put all of that side by side and the pattern is hard to miss. The rescue made the institutions whole and made money doing it, while the losses the state did not absorb stayed where they fell, in households. The people who would run capital over the next decade took a lesson from that, and commercial real estate is where it showed up.
Then It Reached Commercial Real Estate
Commercial real estate reached the crisis late. Green Street’s Commercial Property Price Index peaked in August 2007 and hit bottom in May 2009 at 61.7, against a peak of 100, a drop of roughly 38%. CMBS issuance went from about $229 billion in 2007 to $12 billion in 2008 and $3 billion in 2009. In Federal Reserve data, delinquency on banks’ commercial real estate loans peaked at 8.76% in the second quarter of 2010. CMBS delinquency, as Trepp tracks it, kept climbing until July 2012, when it hit a record 10.34%.
Sorkin finished his book in 2009, and near the end of his epilogue he turns to this market. Vulture investing was back in fashion, he writes, with everyone raising money for a collapse in commercial real estate and the bargains it would bring. What happened next explains why that fire sale came out smaller than its buyers expected, and three stories show how.
General Growth Properties. On April 16, 2009, GGP, which owned or managed more than 200 regional malls in 44 states, filed for Chapter 11 for roughly 158 of them. Its press release gave the reason plainly: with the credit markets collapsed, it could not refinance its maturing debt outside of bankruptcy. The same release said every one of its shopping centers would keep operating as usual. Of everything from this period, this is the case I find most clarifying. The malls did not fail. The exit did. In November 2009, still in bankruptcy, GGP agreed to restructure about $8.9 billion of mortgage loans, pushing their maturities out to an average of about six years, with none coming due before 2014. In November 2010 it came out with $6.8 billion of new equity, about $15 billion of property debt restructured, and every creditor claim paid in full. When every creditor gets paid in full, the problem was never the malls. GGP needed time, and lenders willing to give it.

Stuyvesant Town. In 2006, Tishman Speyer and BlackRock bought Stuyvesant Town and Peter Cooper Village in Manhattan, 110 buildings and about 11,000 apartments, for a record $5.4 billion, using a $3 billion mortgage and $1.4 billion of secondary loans. The plan was to move thousands of rent-regulated apartments to market rents. Then a state court ruled that about $200 million of the partnership’s rent increases had been improper, the owners could not make a $16 million loan payment due January 8, 2010, and on January 25 they handed the property to their creditors. CalPERS wrote off its $500 million stake. If GGP was an exit failure on a good asset, Stuyvesant Town was the other kind, a pro forma that never showed up. In Part 5’s terms, it was a bridge loan whose exit depended on rents nobody was collecting yet. The property sold for $5.3 billion in 2015, so the asset came back. The 2006 capital stack never did.
Archstone. Part 6 told how Lehman bought into Archstone, a portfolio of high-end apartments, at the very top of the market, and then carried it at values its rivals did not believe. Lehman’s estate did not sell in the panic. In 2012 it bought out Bank of America and Barclays for $1.58 billion and took full ownership, and that November it agreed to sell Archstone to Equity Residential and AvalonBay in a deal valued at about $16 billion, which closed in February 2013. Waiting paid off.
Three properties and three different endings, but the market drew one lesson from all of them: if you can survive until credit comes back, the asset will carry you.
You can see how close the market came to the opposite conclusion in the bond prices. In the weeks after Lehman failed, according to economists at the Federal Reserve Bank of New York, spreads on the most highly protected CMBS bonds reached about 1,500 basis points. Part 4 gave us a way to read a spread:
p ≈ s ÷ (1 – R)
Take the terms one at a time. s is the annual spread an investor demands for carrying the credit risk. p is the annual probability of default that spread implies. R is the recovery rate, so (1 – R) is the share of principal lost in a default. Rearranged, s ≈ p x (1 – R), which makes the spread the market’s price for expected loss per year. At 1,500 basis points, the market was pricing the safest CMBS bonds as if they would lose something like 15% of their value every year.
The Fed’s answer was TALF, a facility that lent investors the money to buy asset-backed securities, CMBS among them. The legacy CMBS program held its first subscription in July 2009, only one new-issue CMBS deal was ever financed through it, and TALF finished without a loss. The bonds the market had priced for catastrophe turned out to be good collateral. To me, that is the clearest sign that a spread is not a forecast. In late 2008 it was the price of fear, of not being able to sell and of not knowing who was standing on the other side, and the fear turned out to be far more expensive than the losses.
Extend and Pretend, the First Time
On October 30, 2009, the Federal Reserve, the FDIC, the OCC, the Office of Thrift Supervision, the NCUA and the state supervisors adopted a joint policy statement on commercial real estate loan workouts. Two things in it mattered. Banks that restructured loans prudently, after a proper review of the borrower, would not be criticized for it. And performing loans to creditworthy borrowers would not be classified adversely just because the collateral had lost value.
A few months later it became clear how much that statement was holding back. In February 2010 the Congressional Oversight Panel estimated that about $1.4 trillion of commercial real estate loans would reach the end of their terms between 2010 and 2014, and that nearly half were underwater, meaning the borrower owed more than the property was worth.
The market had a name for what came next: extend and pretend. Lenders extended maturities instead of foreclosing, and both sides acted as if the value would be there when the extension ran out. The Federal Reserve is what made the pretending come true. On December 16, 2008, it had cut its target rate to a range of 0 to 0.25%, and it kept it there for seven years, until December 2015. The 10-year Treasury yield averaged 3.26% in 2009 and 1.80% in 2012, touching 1.43% that July.
To see why that rescued loans, write down what a refinance actually requires. When a loan matures, the next lender sizes the new one three ways and lends the smallest amount:
Maximum refinance loan = min( LTV x NOI ÷ exit cap , NOI ÷ (DSCR x k) , NOI ÷ DY_min )
Take the terms one at a time. NOI is the property’s net operating income at maturity. LTV x NOI ÷ exit cap is the loan-to-value test: the lender values the property by capitalizing NOI at the market cap rate and advances a fraction of that value. NOI ÷ (DSCR x k) is the coverage test. Here k is the mortgage constant, the annual debt service per dollar of loan, which depends on the interest rate and the amortization, and the lender wants NOI to cover that debt service DSCR times. NOI ÷ DY_min is the debt yield test: NOI has to be at least a minimum percentage of the loan.
Now look at what moves each term. The first two have the interest rate inside them, the first through the cap rate and the second through k. The third has no rate in it at all, and it only moves when NOI moves. Keep that in mind, because it comes back at the end of this part. For the examples here, I size the loans the way agency multifamily lenders largely do, on the first two terms.
Here is an example. The assumptions are mine, picked to be plausible for the period, and they are not market data. An apartment property earned $1,000,000 of NOI at the 2007 peak and carries an $11.5 million loan. By 2009 its NOI has fallen 10%, to $900,000. The lender will go to 70% of value and wants a 1.25x DSCR on a 30-year amortization.
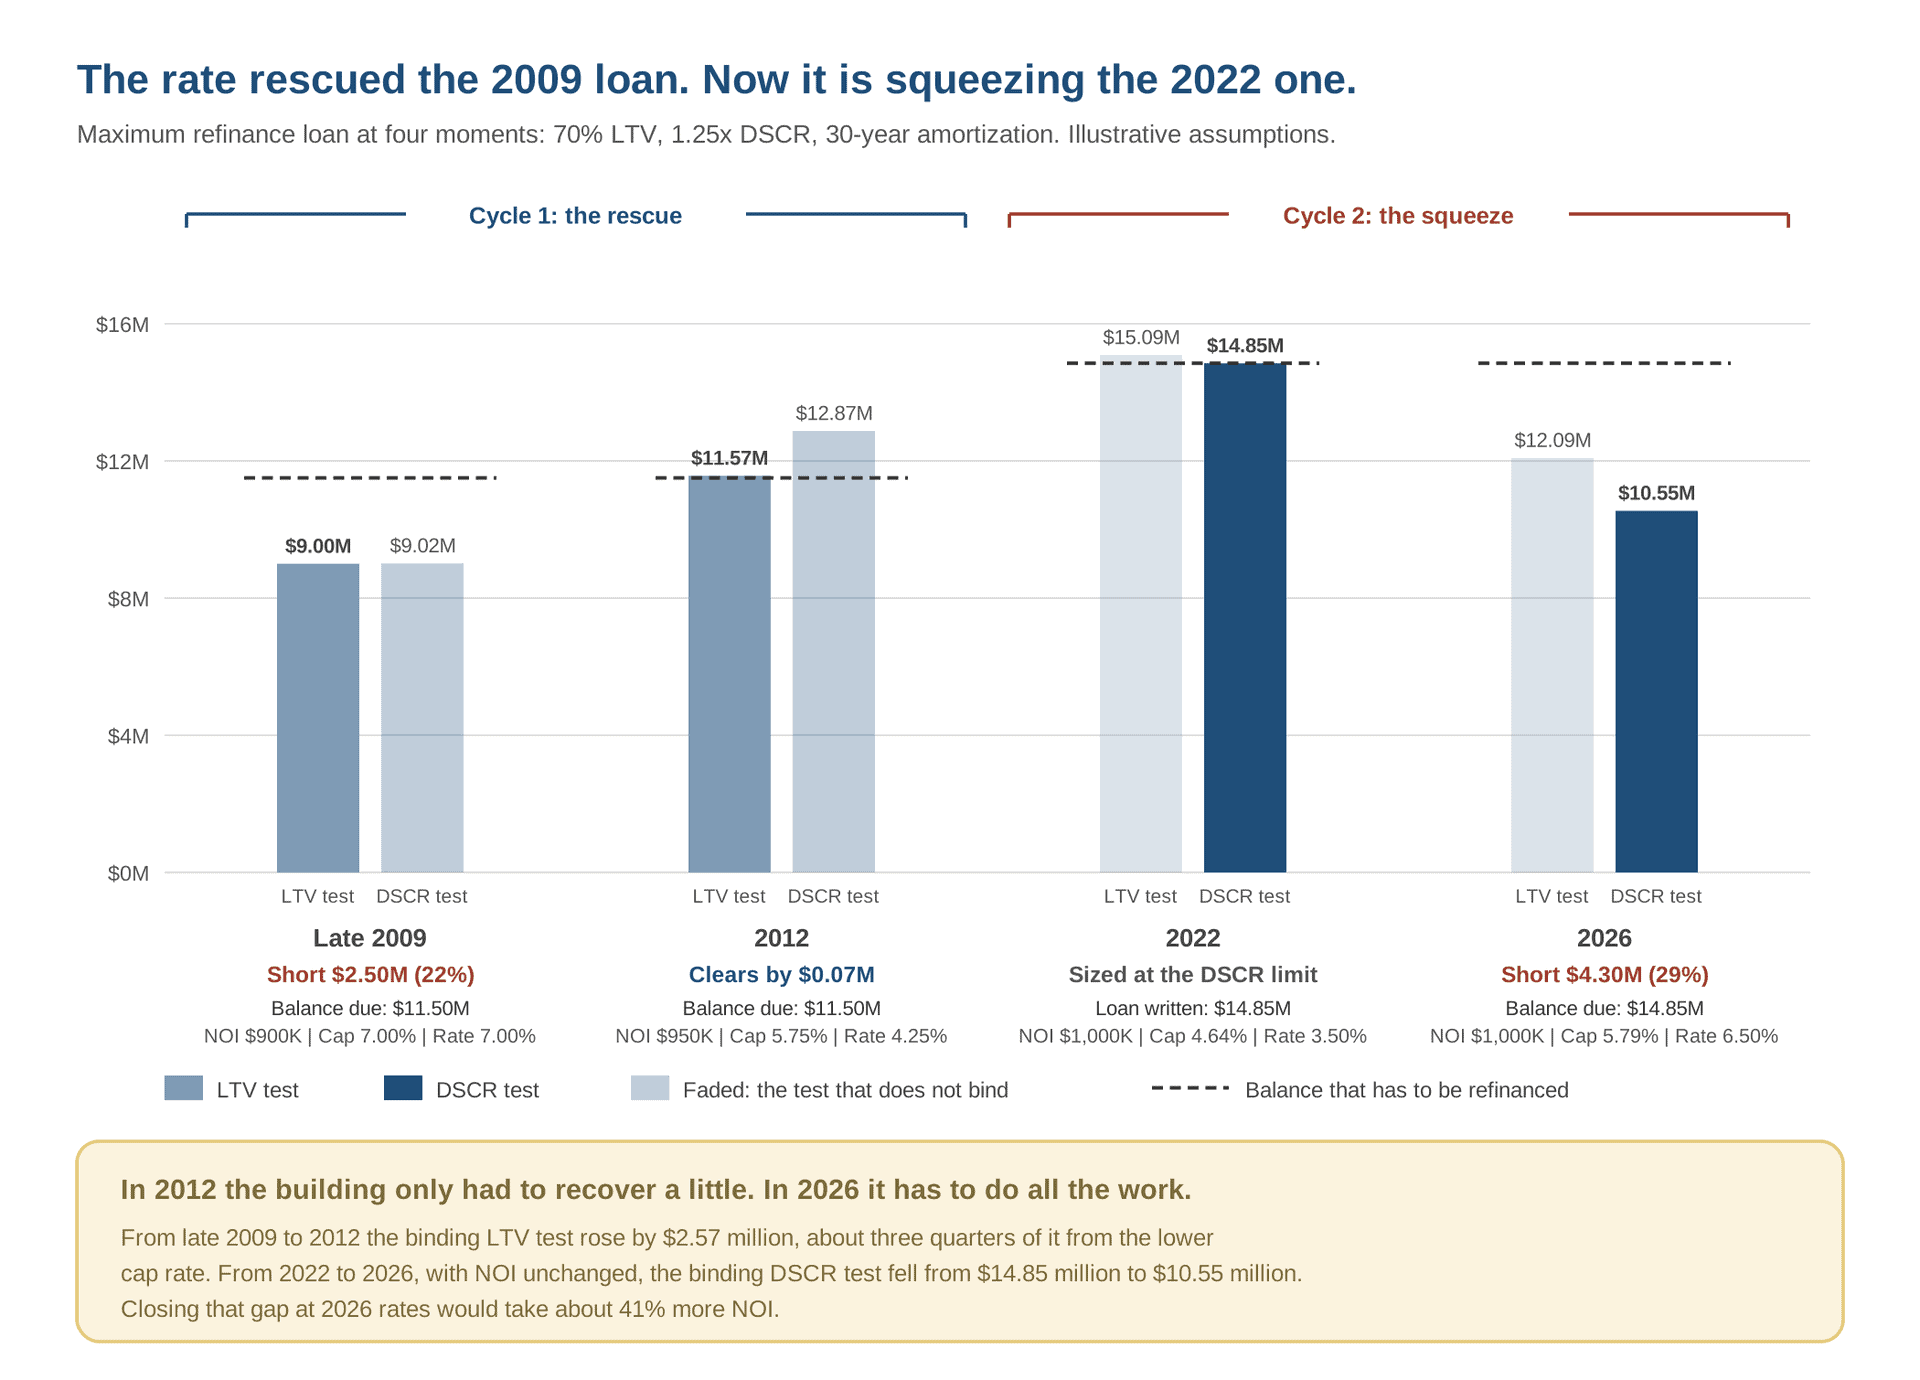
In late 2009, with a cap rate of 7.0% and a loan rate of 7.0% (k = 0.0798):
- LTV test: 0.70 x $900,000 ÷ 0.070 = $9.0 million
- DSCR test: $900,000 ÷ (1.25 x 0.0798) = $9.02 million
The new loan tops out at $9.0 million, $2.5 million short of the balance, or about 22%. The loan cannot refinance, and under the 2009 policy statement it does not have to. It gets extended.
By 2012, NOI has recovered to $950,000, still 5% below the peak. The cap rate is 5.75% and the loan rate 4.25% (k = 0.0590):
- LTV test: 0.70 x $950,000 ÷ 0.0575 = $11.57 million
- DSCR test: $950,000 ÷ (1.25 x 0.0590) = $12.87 million
The new loan is $11.57 million, which clears the $11.5 million balance. Barely, but it clears.
Now pull apart where the improvement came from. The LTV test, the one that binds, rose by about $2.57 million. Hold NOI at $900,000 and change only the cap rate, and you get $1.96 million of that, roughly three quarters. The building recovered a little, and the rate did most of the work.
That is the sentence I would underline in this whole part: the loan was rescued by the rate, not by the property. Everyone who lived through those years, borrowers, lenders and investors alike, took the same lesson from it, that if you can extend long enough, the exit comes back. If you want to run this test on your own deals, A.CRE’s Refinance Risk Analysis Tool computes LTV, DSCR and debt yield at maturity under a stressed NOI.
The New Rules, in Brief
In his epilogue, Lewis makes a point a commercial real estate reader will recognize. No investment bank owned by its own partners, he argues, would have levered itself 35 to 1. In capital stack terms, that is a building with less than 3% equity under it. Most of the rules written after 2008 tried to put more equity under the banks and more transparency under the bonds.
Basel III. In September 2010, the governors overseeing the Basel Committee agreed to raise banks’ minimum common equity requirement from 2% to 4.5% of risk-weighted assets, add a 2.5% conservation buffer for a total of 7%, and test a minimum leverage ratio of 3% that ignores risk weights altogether. Two liquidity rules followed in final form, the Liquidity Coverage Ratio in 2013 and the Net Stable Funding Ratio in 2014, and the package was completed in December 2017. In the United States, the new capital rules also put a 150% risk weight, effective January 1, 2015, on high volatility commercial real estate, meaning construction loans made without enough borrower equity.
Dodd-Frank. Signed on July 21, 2010, it touched commercial real estate in two places that matter here. Since December 24, 2016, CMBS sponsors have had to retain 5% of the credit risk, and B-piece buyers can satisfy that requirement by holding the most subordinate bonds. And under the SEC rules that followed, public CMBS have disclosed their data loan by loan since November 23, 2016.
What did not change. Fannie Mae and Freddie Mac, where this series started in Part 1, went into conservatorship in September 2008, and according to the Congressional Research Service they were still there in August 2026.
What is still open. The last piece of Basel III in the United States, the so-called endgame, still has not been settled. A 2023 proposal would have raised capital for the largest banks. The re-proposal of March 19, 2026, goes the other way: Federal Reserve staff estimated that, together with a revised surcharge for the largest global banks, it would lower the aggregate common equity requirement of the biggest firms by 2.4%. As I write this, it has not been finalized.
One of Basel III’s own creations would later be tested in a way its designers had planned for and its investors had not. That happened at Credit Suisse, and it belongs with the derivatives.
The Derivatives Never Left
Part 6 closed on two numbers. The first, $366 billion, was what would have had to change hands on Lehman’s credit default swaps if nothing could be offset. The second, $5.2 billion, was what actually moved once everything was netted. The gross number was the question and the net number was the answer, and that is still the right way to read the derivatives market, because the gross number is bigger now than it was in 2008.
At the end of June 2008, the Bank for International Settlements put the notional amount of over-the-counter derivatives outstanding at $683.7 trillion. At the end of 2025, ISDA’s analysis of BIS data put it at $844.6 trillion. Part of that difference comes from a wider group of reporting dealers, about 11% of the 2025 total, but the market is plainly larger than it was before the crisis.
Notional, though, is not what is at risk. It is the face amount that payments are calculated on, and two better measures sit under it. Gross market value is what it would cost to replace every contract at market prices: $20.4 trillion in June 2008 and $22.8 trillion at the end of 2025. Gross credit exposure is what is left after legally enforceable netting between counterparties: $3.9 trillion in June 2008 and $3.4 trillion at the end of 2025, about 0.4% of notional.
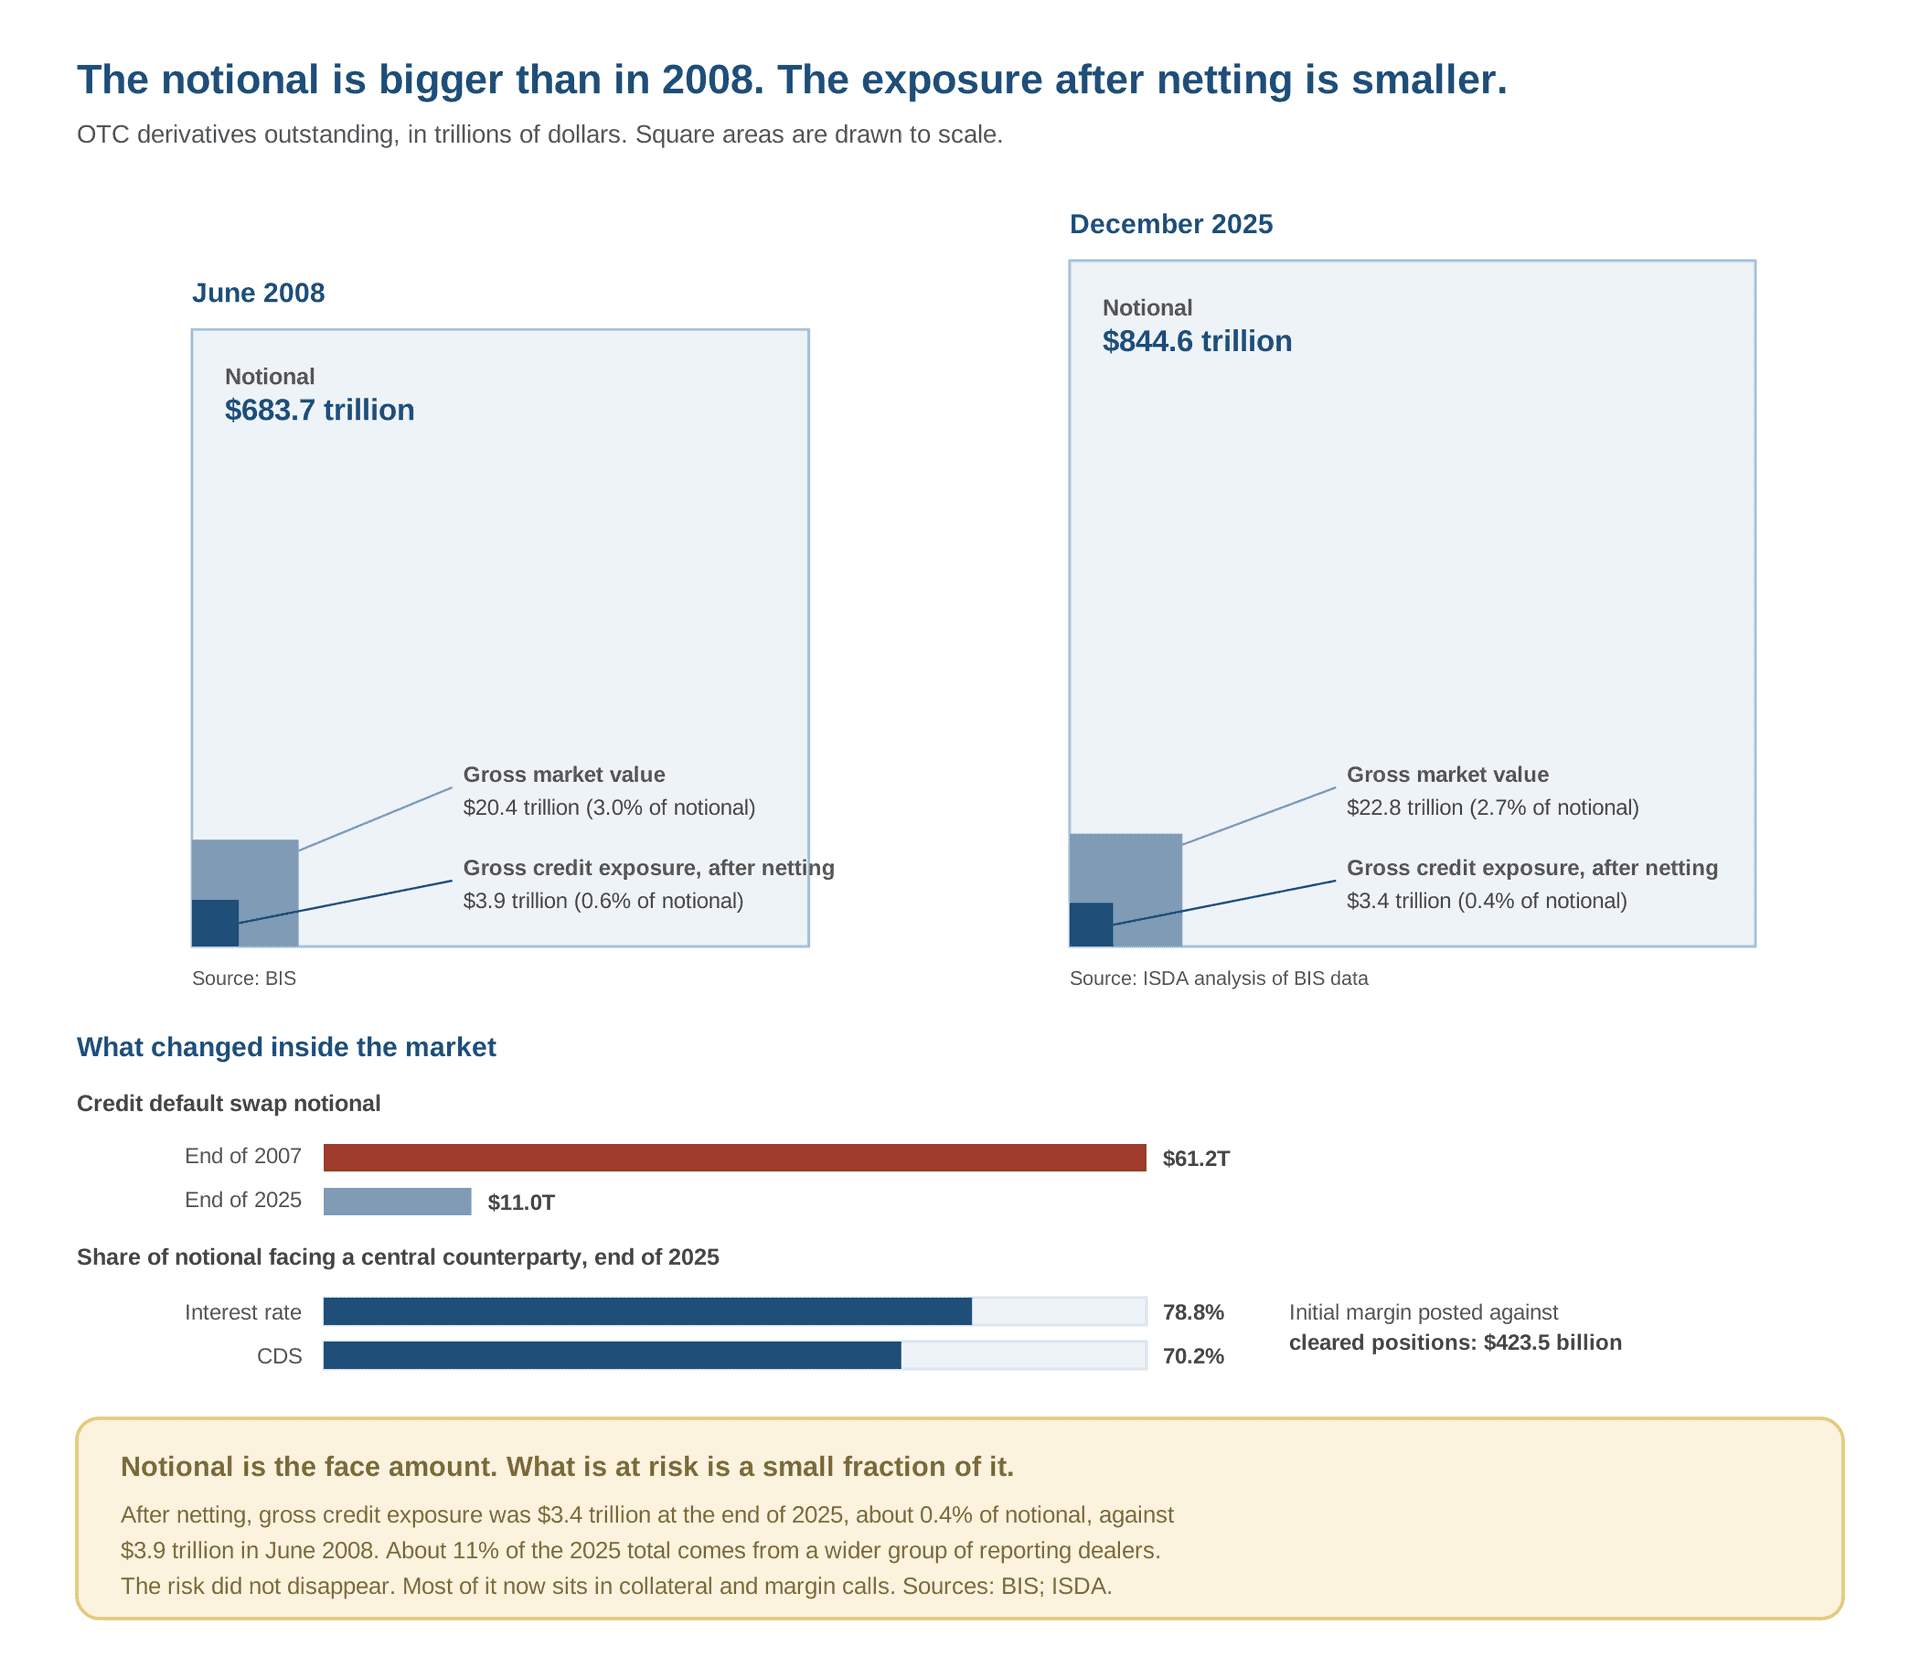
The mix changed too. Credit default swaps, the instrument at the center of Parts 4 and 6, went from $61.2 trillion of notional at the end of 2007 to $11.0 trillion at the end of 2025, and interest rate derivatives now make up 79.3% of the market. Most of it no longer sits in a web of private bilateral contracts, either. Of the interest rate derivatives, 78.8% face a central counterparty, as do 70.2% of credit default swaps, and members had posted $423.5 billion of initial margin against cleared positions at the end of 2025.
What stands out to me is that the risk did not go away. It moved. In 2008 the danger was a counterparty that had promised to pay and had posted nothing. Today most of the market is collateralized, so the danger is the collateral itself: a sharp move in prices triggers margin calls, whoever is leveraged has to find cash, and the forced selling pushes prices further. That is the mechanism that brought down AIG. Since 2021 it has come back twice, both times outside the banks, and a third episode tested one of the safety devices built after 2008.
Archegos, 2021. A family office built huge stock positions through total return swaps with several banks, and none of them could see the whole thing. Prosecutors said its portfolio grew from $10 billion to $160 billion. When the stocks fell in March 2021 and the margin calls could not be met, the banks sold the positions off. Credit Suisse alone lost about $5.5 billion, according to its own investigation. The founder, Bill Hwang, was sentenced to 18 years in November 2024 by Judge Alvin Hellerstein, the same judge who had sentenced Kareem Serageldin eleven years earlier.
British pension funds, 2022. Liability-driven investment funds used derivatives and borrowing to hedge pension liabilities against falling interest rates. When gilt yields jumped in September 2022, collateral calls forced them to sell gilts, which pushed yields higher and set off more calls. The Bank of England’s Financial Policy Committee described that spiral in almost exactly those terms. The Bank stepped in and bought £19.3 billion of gilts between September 28 and October 14.
Credit Suisse, 2023. When the bank was rescued through its sale to UBS in March 2023, the Swiss regulator FINMA ordered about CHF 16 billion of its AT1 bonds written down to zero. AT1 bonds are a Basel III instrument, designed precisely to absorb losses while a bank is still alive. In October 2025 the Swiss Federal Administrative Court ruled the write-down unlawful. FINMA and UBS appealed, and as I write this the bonds are still written down while the case sits with the Federal Supreme Court.
There is also a derivative sitting on a lot of CRE desks right now. Floating-rate bridge lenders typically make the borrower buy an interest rate cap, and when the cap expires before the loan does, the borrower has to buy a new one. According to Chatham Financial, a three-year cap at a 3% strike on a $100 million loan cost $98,000 in April 2019 and $3.48 million in May 2023. That is a small collateral call, written into the business plan of a great many 2021 bridge loans.
Could the derivatives market set off something like 2008 again? I honestly don’t know, and I’d be suspicious of anyone who claims to. What I can do is show you where the people paid to worry about it are looking, and it is not at the notional. The Federal Reserve’s May 2026 Financial Stability Report flags leverage at hedge funds, which it says remained near all-time highs and concentrated in a small number of large funds. The worry is leverage sitting in places where nobody sees the whole position. That is exactly where Archegos was, and if Part 6 taught us anything, it is also where AIG was.
A Decade at Zero
The Federal Reserve kept its target rate at 0 to 0.25% from December 2008 to December 2015, and went back to that range from March 2020 to March 2022. On August 4, 2020, the 10-year Treasury yield closed at 0.52%, the lowest in data going back to 1962.
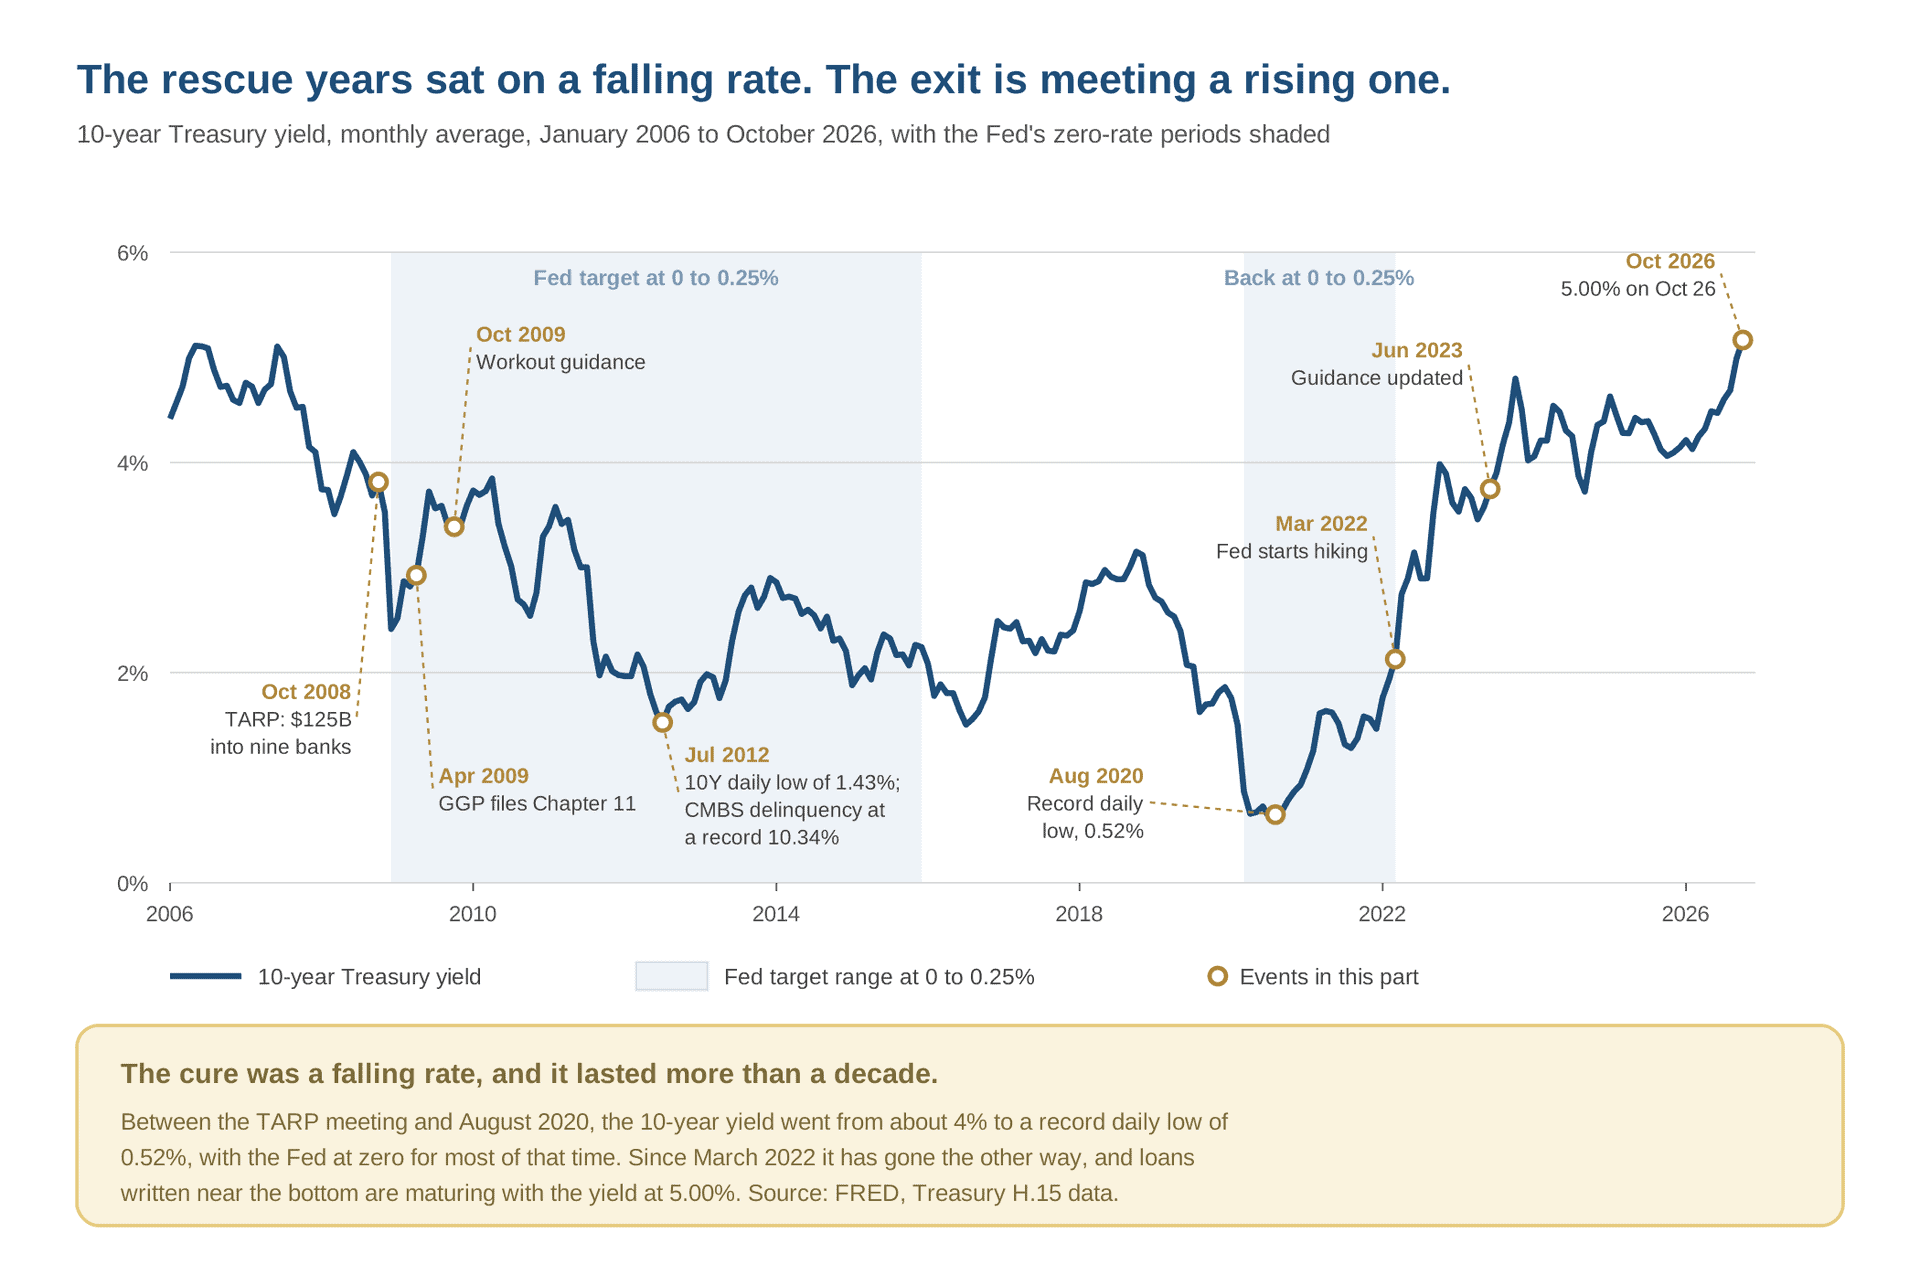
For commercial real estate, cheap money did two things. First, it made the recovery fast. By December 2010 Green Street’s index was more than 30% above its 2009 low, and the firm noted that half of the 2007 to 2009 decline had already been erased, in about a year and a half. Second, it pushed values up for a decade. Apartment cap rates, in MSCI data reported by RealPage, bottomed at 4.64% in the second quarter of 2022, and Green Street’s index peaked that March.
It also turned the houses of Part 1 into an institutional asset class. Invitation Homes, sponsored by Blackstone, started operating in 2012, buying single-family houses to rent, some of them at auctions of foreclosed homes. It went public on February 6, 2017, and by the end of that year, after merging with Starwood Waypoint, it owned 82,570 homes.
And it produced the vintage being tested today. In 2021, according to Morningstar DBRS, CRE CLO issuance reached a record of about $50.4 billion. Those deals pooled floating-rate bridge loans on transitional properties, many of them apartment buildings bought to renovate and re-rent, with the exit planned as a refinance into permanent debt or a sale at a low cap rate.
Looking back, what strikes me about this period is how reasonable it all looked from the inside. The previous cycle had already tested those business plans, and its answer had been: survive, extend, and the exit comes back. Sorkin closed his epilogue in 2009 worried that the survivors had come out of the crisis with a sense of invulnerability and no humility. A decade at zero gave that feeling a track record.
The Exit, Again
Between March 2022 and July 2023, the Federal Reserve raised its target range from 0 to 0.25% up to 5.25 to 5.50%, 525 basis points in sixteen months. It cut the range back to 3.50 to 3.75% by December 2025 and, in September 2026, raised it again, to 3.75 to 4.00%. On October 26, 2026, the 10-year Treasury yield stood at 5.00%.
Now run the same formula forward. Take an apartment property with $1,000,000 of NOI, financed in 2022 by the same kind of lender: 70% of value, 1.25x DSCR, 30-year amortization. The rates are illustrative again, while the cap rates are MSCI’s, as reported by RealPage.
In 2022, with a cap rate of 4.64% and a loan rate of 3.5% (k = 0.0539):
- LTV test: 0.70 x $1,000,000 ÷ 0.0464 = $15.09 million
- DSCR test: $1,000,000 ÷ (1.25 x 0.0539) = $14.85 million
That gives a $14.85 million loan with a 6.7% debt yield.
In 2026, with NOI unchanged, a cap rate of 5.79%, the highest since 2015, and a loan rate of 6.5% (k = 0.0759):
- LTV test: 0.70 x $1,000,000 ÷ 0.0579 = $12.09 million
- DSCR test: $1,000,000 ÷ (1.25 x 0.0759) = $10.55 million
The new loan is $10.55 million. That leaves a $4.30 million gap, 29.0% of the balance, and to close it at 2026 rates, NOI would have to rise about 41%. In 2012 the formula ran in the borrower’s favor, and the building only had to recover a little. In 2026 it runs the other way, and the building has to do all of the work.
Now bring back the third term. Rearrange the coverage test and it says something simple: a loan refinances at par only if NOI ÷ Loan ≥ DSCR x k. NOI ÷ Loan is just the loan’s debt yield, so the coverage test is really a debt yield floor, one that floats with the interest rate:
Share of loans that cannot refinance = P( DY_i < DSCR x k )
Take the terms one at a time. DY_i is each loan’s debt yield on its current balance, and it moves only when that loan’s NOI moves. DSCR x k is the floor, and it moves with the rate. P( ) is the share of loans whose debt yield sits below that floor. At 3.5%, the floor was 6.7%, exactly where the 2022 loan was sized. At 6.5% it is 9.5%. In the 2009 example it was about 10.0%, and by 2012 it had dropped to 7.4%. This is the piece I had not properly understood before working through it: for more than a decade the floor kept sinking, and every loan that cleared it looked like good underwriting.
A meaningful share of today’s loans sits below even a modest floor. Trepp found that 36% of the $76.6 billion of CMBS loans with hard maturities in 2026 have a debt yield of 8% or less. If the 2022 loan above had been sized at a 9% debt yield instead, it would have been $11.11 million, and the 2026 gap would be about $564,000, or 5%. That is a check a sponsor can write.
The distress is selective, and since every loan faces the same floor, what separates them is income. In Trepp’s September 2026 data, overall CMBS delinquency was 8.02%, the highest since November 2020 and still below the 2012 record. Office, at 12.16%, is above its peak from the last crisis, and multifamily, at 8.04%, has moved above the overall rate. CRED iQ put distress in CRE CLOs at 28.2% in August, concentrated in Sun Belt apartment bridge loans from 2021 and 2022 that were underwritten on rent growth that never arrived. It is Stuyvesant Town’s pattern on a smaller scale, in many more places.
Lenders are extending again, too. In June 2023 the bank regulators updated the 2009 policy statement and added a section on short-term loan accommodations. The Fed’s May 2026 Financial Stability Report notes that lenders’ willingness to extend or modify maturing loans has helped limit the risk so far. Matteo Crosignani and Saketh Prazad, economists at the New York Fed, find that weakly capitalized banks gave distressed CRE borrowers maturity extensions and payment relief, and that this pushed more maturities into the near term. An extension buys time. In 2009, that time came with a falling rate. This time it has not.
That leaves Part 6’s question: who is standing on the other side today, and can they pay? The answer is better than it would have been in 2008. In CMBS, the first loss sits with B-piece buyers, who put their money in on the day the deal closed and have to hold it for five years. Banks carry more capital than they used to, and delinquency on their commercial real estate loans was 1.53% in the second quarter of 2026, against 8.76% in 2010. The losses are visible, reported loan by loan every month, and they land on money that is actually there. What the rules could not change is the assumption sitting inside the underwriting.
Where the Story Ends
Every part of this series has turned on an assumption. In Part 1, it was that Washington stood behind Fannie and Freddie, and that house prices do not fall nationally. In Part 2, that someone in the chain was checking whether the borrower could pay. In Part 3, that defaults would not arrive together. In Part 4, that the sellers of protection could pay. In Part 5, that prices would keep rising. In Part 6, that everybody on the other side would pay. In this part it is that the exit comes back, and of the seven, it is the only one the crisis itself taught.
For now, what I’m taking away from this part is that the cure worked, and that this is exactly the problem. The banks paid back TARP with a profit, and so did AIG. GGP paid every creditor in full, and Archstone and Stuyvesant Town sold for billions once the market reopened. Each of those outcomes was real, and together they turned a rescue into a premise. A generation of capital learned that the exit can come late, but it comes. In 2012 the formula agreed. In 2026 it does not, and the only term left to do the work is the one that never moved with rates: the income of the building.
The series does not quite end here, though. In a short epilogue I want to put the seven parts side by side on one map and ask the question this series has been building toward: what would break today?
Sources and Further Reading
This series is built on two narrative accounts of the crisis, supplemented by the academic and official record. If you want the full story, go to the originals:
- Lewis, Michael. The Big Short: Inside the Doomsday Machine. W. W. Norton, 2010.
- Sorkin, Andrew Ross. Too Big to Fail. Viking, 2009.
- Ashcraft, Adam, Allan Malz, and Zoltan Pozsar. “The Federal Reserve’s Term Asset-Backed Securities Loan Facility.” Federal Reserve Bank of New York Economic Policy Review 18, no. 3 (2012): 29–66.
- Bank for International Settlements. “OTC Derivatives Market Activity in the First Half of 2008.” November 2008.
- Basel Committee on Banking Supervision. “Group of Governors and Heads of Supervision Announces Higher Global Minimum Capital Standards.” Press release, September 12, 2010.
- Board of Governors of the Federal Reserve System et al. “Policy Statement on Prudent Commercial Real Estate Loan Workouts.” October 30, 2009.
- Board of Governors of the Federal Reserve System. Financial Stability Report. May 2026.
- Congressional Oversight Panel. February Oversight Report: Commercial Real Estate Losses and the Risk to Financial Stability. February 10, 2010.
- Crosignani, Matteo, and Saketh Prazad. “Extend-and-Pretend in the U.S. CRE Market.” Federal Reserve Bank of New York Staff Report No. 1130, 2024 (revised 2026).
- International Swaps and Derivatives Association. “Key Trends in the Size and Composition of OTC Derivatives Markets in the Second Half of 2025.” July 2026.
- U.S. Department of the Treasury. “Treasury Receives Payment From Its Final Sale of AIG Common Stock, Bringing Positive Return on Overall AIG Commitment to $22.7 Billion.” Press release, December 14, 2012.
- U.S. Government Accountability Office. Troubled Asset Relief Program: Lifetime Cost (GAO-24-107033). 2024.
Frequently Asked Questions about the 2008 Financial Crisis and Commercial Real Estate
What was TARP and did it work?
TARP, the Troubled Asset Relief Program, authorized the Treasury to inject capital into banks and other institutions after the 2008 collapse. It disbursed $443.5 billion and, according to the GAO’s final accounting, ended with a lifetime cost of $31.1 billion. The bank capital program alone turned a profit of $16.3 billion. What cost money was the housing assistance side, which helped fewer homeowners than promised.
Why did commercial real estate hold up better than expected after 2008?
Three factors mattered. Regulators gave lenders permission to extend maturing loans without foreclosing. The Federal Reserve cut rates to near zero, which lowered cap rates and raised property values even when income had not fully recovered. And high-profile cases like GGP and Archstone showed that waiting, rather than selling in a panic, produced better outcomes for most creditors. Together they produced the lesson that shaped the next cycle: the exit comes back if you can survive long enough.
What is "extend and pretend" in commercial real estate?
Extend and pretend describes the practice of lenders rolling over maturing loans rather than forcing a sale or foreclosure, while both sides act as if the property will eventually support a refinance. After 2008 a federal policy statement explicitly allowed this, and the strategy paid off because falling interest rates eventually made the math work. The phrase has returned in coverage of today’s CRE market for the same reason: loans from 2021 and 2022 are reaching maturity in a rate environment that no longer bails out the underwriting.
How does the interest rate affect whether a commercial real estate loan can refinance?
The two most common sizing tests for a refinance, the loan-to-value test and the debt service coverage ratio test, both move with interest rates. Lower rates reduce the mortgage constant, which lets the same NOI support a larger loan. They also compress cap rates, which raises appraised values and the LTV ceiling. In 2012, after the Fed cut rates to near zero, those effects together turned loans that could not refinance in 2009 into loans that barely could. In 2026, with rates higher, the math runs the other way.
What happened to derivatives after 2008?
The notional outstanding grew, from about $683.7 trillion in mid-2008 to $844.6 trillion by end of 2025. But the structure changed: credit default swaps shrank from $61.2 trillion to $11.0 trillion, and most of the market now clears through central counterparties with collateral posted daily. The risk did not disappear; it moved from unposted counterparty exposure to collateral calls, which can force selling and amplify price moves. Archegos in 2021 and the British pension fund episode in 2022 showed that mechanism still works.
What is the difference between notional value and actual risk in derivatives?
Notional value is the face amount used to calculate payments, not the amount actually at risk. The better measures are gross market value, what it would cost to replace all contracts at current prices, and gross credit exposure, what remains after legally enforceable netting between counterparties. At end of 2025, notional was $844.6 trillion, gross market value was $22.8 trillion, and gross credit exposure was $3.4 trillion, about 0.4% of notional.
How does the 2024-2026 CRE stress compare to what happened after 2008?
The current stress is more selective. Office leads at 12.16% CMBS delinquency, above its 2012 record. Multifamily CRE CLO distress is concentrated in Sun Belt bridge loans from 2021 to 2022 that were underwritten on rent growth that did not materialize. But bank delinquency on CRE loans was 1.53% in mid-2026, compared to 8.76% in 2010, and the transparency rules from Dodd-Frank mean losses are reported loan by loan each month. The main difference is that in 2009 the rate fell to rescue extended loans. In 2026 it has not.
What did Basel III change for commercial real estate lenders?
Basel III raised minimum common equity for banks from 2% to 7% of risk-weighted assets and added a leverage ratio test. For commercial real estate specifically, construction loans made without sufficient borrower equity received a 150% risk weight starting in 2015, making them more expensive for banks to hold. Dodd-Frank added a 5% risk-retention requirement for CMBS sponsors and mandatory loan-level disclosure, so the market can now see who is delinquent rather than having to estimate from index moves.
What is the debt yield test and why does it matter for refinancing?
The debt yield is NOI divided by the loan balance. Lenders use it as a floor: the ratio has to be at least some minimum percentage, regardless of what the LTV or DSCR tests say. Unlike those two tests, the debt yield floor rises when interest rates rise, because lenders tie the minimum to the mortgage constant. That means loans that cleared the floor in a low-rate environment may fall below it when they mature into a higher-rate one, even if the property’s income has not changed.
