Hotel Proforma Basics – Hotel Cash Flow Projection
Hotels are a unique asset in the commercial real estate world and are underwritten differently as a result. Probably the most obvious difference is the duration of the ‘lease term’ of the tenant, which is usually daily to weekly. Another major difference is that hotels are more operating intensive and typically contain other complimentary services and operations such as restaurants, bars, and spas, that need to be understood and analyzed independently as well as in context with the larger hotel operation. This second point probably has the most substantial impact on the hotel proforma and how it is setup.
You may also be interested in downloading our hotel proformas:
The Hotel Proforma Setup
Below is a screen shot of the detailed operating cash flow worksheet in our A.CRE Hotel Valuation Model:
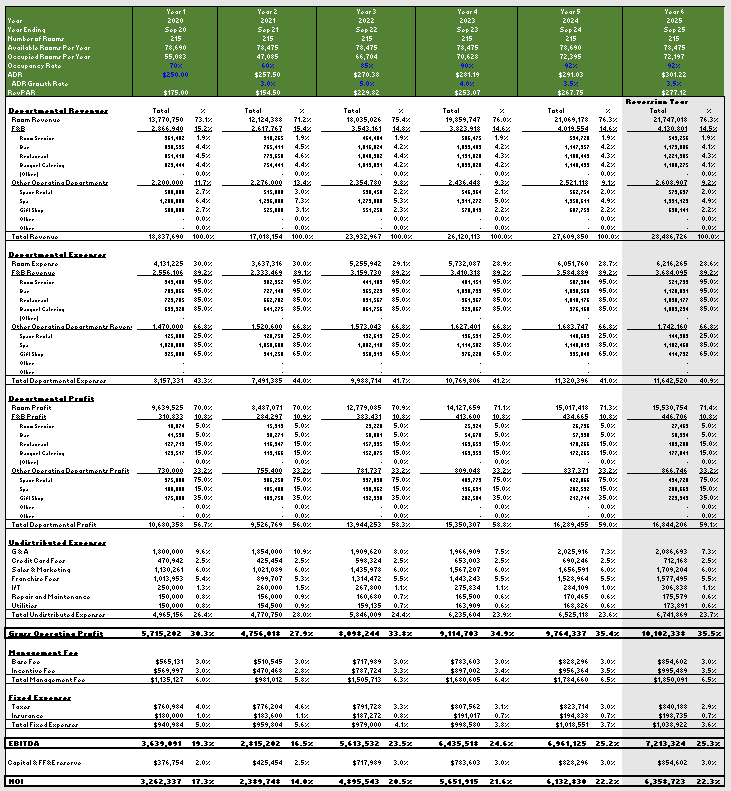
You can also download this as a pdf for review below.
For the remainder of this post, we will be using this pdf as a reference.
The Header
The headers of hotel cash flow projection are unique. They usually provide the following information as shown in the pdf:
- Year
- Number of Rooms
This is simply the total number of rooms the hotel has. - Available Rooms per Year
Number of Rooms multiplied by the days in the year. - Occupied Rooms Per Year
Available Rooms per Year multiplied by the projected Occupancy Rate below. - Occupancy Rate
Projected annual occupancy rate for the hotel in a given year. - ADR
This is the projected rate that will be charged on average for all the rooms. - ADR Growth Rate
The projected growth of the ADR on a year over year basis. - RevPAR
Revenue Per Available Room is the ADR multiplied by the Occupancy Rate. In other words, this is showing the ADR earned in the occupied rooms spread evenly over all the available rooms.
Hotel Proforma Sections
With the multiple different major revenue/operating streams such as a restaurant, room service operations, or a gift shop needing to be reviewed on a standalone basis to understand the profitability of each; a typical hotel operating proforma is set up as follows:
ADD: Departmental Revenues
LESS: Departmental Expenses
EQUALS: Departmental Profit
LESS: Undistributed Expenses
EQUALS: Gross Operating Profit
LESS: Fees and Fixed Expenses
EQUALS: NOI
LESS: CapEx
EQUALS: Cash Flow from Operations
Compared to a more typical commercial real estate proforma:
ADD: Revenue
LESS: Expenses
EQUALS: NOI
LESS: CapEx
EQUALS: CFO
Departments
As mentioned above, the proforma seeks to break down each department so that they can be analyzed independently. Let’s look at the pdf and take the bar for example. The hotel proforma allows us to follow how the bar is performing in isolation. We can see the bar’s revenue and correlating expenses and profit. This will help investors to get a better picture of the hotel’s bright spots and problem areas and/or costs of doing business.
Undistributed Expenses
As the title implies, these are expenses that are typically not allocated to one department, but are general shared costs of doing business and are expensed at the general level. In this example we have G&A, Credit Card Fees, Sales and Marketing, I/T, Repair and Maintenance, and Utilities. Additionally, there are Franchise Fees, which are usually rolled up in to Sales & Marketing, but I wanted to pull it out as this is an important expense to understand.
Franchise Fees
Franchise fees are charged to a hotel owner by the flag, or hotel brand, that has their name on the hotel and is managing the property. The typical fees involved in this category are as follows:
- The initial fee
- Marketing fees
- Royalties
- Reservation fees
There are numerous great resources on franchise fees on the internet. I’ve linked to two that I have found particularly useful below:
Gross Operating Profit
The Gross Operating Profit is the value created from the hotel and all its departments before adding the less controllable expense line items such as fees and taxes.
Management Fees
The hotel management fee is usually broken down into two components: a base fee that is guaranteed and an incentive fee. The incentive fee can be structured in numerous ways. One conventional way is for the owner and manager to agree to a revenue or profit metric goal and upon reaching that goal, management begins to participate in the additional proceeds.
The remaining lines items in the hotel proforma will not be covered as they should be self explanatory or have been covered extensively in other posts on the site.
Percent of Revenue Analysis
One final unique aspect of the hotel proforma cash flow projection is that you will see percentages next to each number for every line item in every year. Although they may vary slightly from proforma to proforma, in this model they are broken out as follows:
- Departmental Revenue line items are showing the respective line item as a percent of Total Revenue
- Departmental Expense line items are showing the respective line item as a percent of its respective revenue line item in the Departmental Revenue section
- Departmental Profit line items are also showing the respective line item as a percent of its respective revenue line item in the Departmental Revenue section
- The remaining items in the proforma are showing the respective line item as a percent of Total Revenue.
Frequently Asked Questions about Hotel Proforma Basics – Hotel Cash Flow Projection
How is a hotel proforma different from a typical real estate proforma?
Unlike typical real estate, hotels have short-term tenants and multiple operating departments. The hotel proforma reflects this by breaking down revenues and expenses by department and adding detailed operational line items like Departmental Revenues, Undistributed Expenses, and Franchise Fees.
What key data points are included in the hotel proforma header?
The header typically includes:
Year
Number of Rooms
Available Rooms per Year
Occupied Rooms per Year
Occupancy Rate
ADR (Average Daily Rate)
ADR Growth Rate
How are departments like restaurants or bars handled in the proforma?
Each department is analyzed independently. For example, the bar’s revenue, expenses, and profit are shown as standalone items. This allows for a detailed review of profitability by department and helps identify strong and weak performers within the hotel.
What are Undistributed Expenses in a hotel proforma?
Undistributed Expenses are shared costs not assigned to any specific department. These include G&A, Credit Card Fees, Sales and Marketing, IT, Repairs and Maintenance, Utilities, and often Franchise Fees.
What types of Franchise Fees are typically included?
Franchise Fees often include:
Initial Fee
Marketing Fees
Royalties
Reservation Fees
These are paid to the hotel brand managing the property.
What is Gross Operating Profit (GOP) in a hotel proforma?
Gross Operating Profit is calculated as Departmental Profit minus Undistributed Expenses. It represents value created by hotel operations before deducting less controllable items like fees and CapEx.
How are management fees typically structured?
Hotel management fees usually consist of a base fee and an incentive fee. The incentive portion often kicks in once the hotel meets a specified revenue or profit goal.
How is percent-of-revenue analysis used in a hotel proforma?
Percentages next to each line item show its proportion relative to revenue:
Departmental Revenue items are shown as a percent of Total Revenue
Departmental Expenses and Profits are shown as a percent of their respective departmental revenue
All other items are shown as a percent of Total Revenue
Where can I find hotel proforma templates to download?
You can download templates like the A.CRE Hotel Valuation Model and Hotel Acquisition Model from the A.CRE website as referenced in the blog post.


