Tutorials For The Hotel Valuation Model (Updated 07.23.19)

Welcome to the A.CRE Hotel Valuation Model‘s Tutorial Page. On this page you will find all the tutorials for the A.CRE Hotel Valuation model in Excel. There is a lot to learn within this model and over time, I’d like to show you both how to use it as well as how I built it. In the first seven tutorials, we will focus on how to use the hotel valuation model by going through each tab, one at a time. I hope this is helpful and please contact me with any requests, suggestions, or if you happen to find errors.
To download, visit the Hotel Valuation Model in Excel Main Page
Tutorials for the Hotel Valuation Model in Excel
Note: This workbook contains macros so upon opening, if you are prompted with the following – ‘SECURITY WARNING Macros have been disabled.’ – please click the ‘Enable Content’ box. The model will not work properly without macros enabled.
Tutorial 1 – The Summary Tab
Tutorial 2 – CFSummary Tab (High Level Cash Flow Summary)
Tutorial 3 – OpCashFlow Tab (Detailed Operating Cash Flows)
Tutorial 4 – F&B Tab (Food and Beverage Inputs and Review)
Tutorial 5 – OthOppDepts Tab (Other Operating Departments Inputs)
Tutorial 6 – OthExpenses Tab (The Remaining Expense Inputs)
Tutorial 7 – Penetration Tab (Penetration Analysis)
Tutorial 8 – Waterfall – IRR Hurdles Tab
Tab 1. Cover
The cover sheet is where you will find any relevant links to videos or websites that are relevant or in support of the Hotel Valuation model. Additionally, as the model is updated over time, version notes that document the updates will be shown in this tab.
Tutorial 1 – The Summary Tab (Updated 07.23.19)
As you have probably guessed, the Summary tab is where you will find all of the high level and important information and metrics that needs to be shown up front for review by you and any third party. In addition to displaying this information, this tab also contains many important inputs for the model. As is the case in all of our models and on every sheet in this particular model, any cells that contain blue text or numbers are drivers that you should alter and update according to your specific conditions. In this sheet, all of the blue inputs are located in the boxes on the left hand side. Please see the video below for for an overview of this tab.
Note: This tab and video have been updated. However, the original video does a high level walk through of each tab as an introduction, so I have linked it here if there is an interest: Model Overview
Summary Tab Video
Tutorial 2 – CFSummary Tab (High Level Cash Flow Summary) (Updated 07.23.19)
The CFSummary tab gives the user a high level review of the entire investment cash flow, from acquisition to disposition. Rows 60 and 62 show unlevered and levered cash flows, respectively, and at the bottom of the sheet you can review the following annual return and risk metrics by year: free and clear return, cash on cash return, debt service coverage ratio, and the debt yield.
Cash Flow Summary Worksheet Video
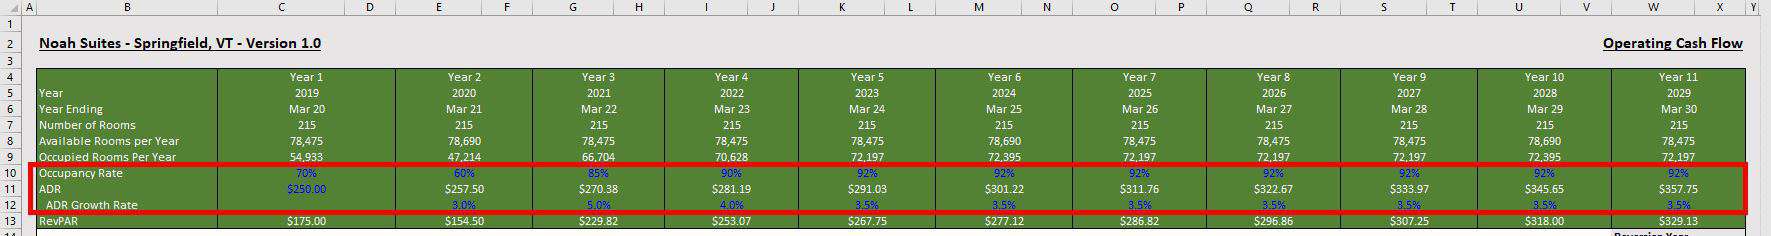
Tutorial 3 – OpCashFlow Tab (Detailed Operating Cash Flows) (Updated 07.23.19)
This page provides a detailed overview of the operating cash flows by line item. There are a few unique attributes in hotel proformas that are different than the typical real estate proforma. I’ve created a companion post using this worksheet that provides an overview and goes over these differences in general detail, which can be found [here].
This worksheet also contains a few important inputs in the header.
- In row 10, you will set the occupancy rate for each year
- Cell C11, you will set the ADR in year 1
- and in row 12, you wil set the ADR Growth Rate for each year.
In the image below, you can see these sections within the red box with the inputs in blue text. Click on the image for a closer view.
Operating Cash Flow Worksheet Video
Tutorial 4 – F&B Tab (Food and Beverage Inputs and Review)
The video below will walk you through this tab and you can also read the guide below the video:
F&B Tab Video
On this worksheet you have the ability to detail five specific F&B offerings. Cells F6:J6 is where you will insert the names of the F&B offering. What’s currently plugged in now is the following: Room Service, Bar, Restaurant, Banquet Catering, and [Other].
Below that in Cell F8, you will insert the average guest per room. This is needed because we calculate meal revenue and expenses based on a per person calculation and we need to understand how many people are occupying a room on average in order to do this.
F&B Revenue Inputs
Cells D10:K60 – What Percentage of the Occupied Rooms Use the F&B Offerings
The next section below asks ‘What Percentage of the Occupied Rooms Use the F&B Offerings?’ (Cells D62:K88). Here you have the ability to project room usage of the F&B by meal.
Simple vs. By Year
Simple
To provide a consistent and simple percent of occupied rooms that use the F&B by meal, make sure Cell E13, Simple, is clicked. From here you can fill in what percent of the occupied rooms use the F&B offerings for the hold period.
By Year
If there is an anticipation of a change in F&B usage over time, then click Cell E14, ‘By Year’. Here you can alter F&B usage by occupied rooms per meal for each year. This is particularly helpful in many cases such as a restaurant repositioning or making improvements to one of the F&B offerings to encourage growth.
Cells D62:K88 – Number of Non-Hotel Guests That Use the F&B Per Year
In this section you can project the amount of non hotel guests utilize the F&B options. As with the occupied room inputs above, this section provides you with a Simple option by clicking on Cell E65 where you assume the inputs are static through the investment, and the By Year option, Cell E66, where you also have the ability to analyze projected growth in use.
Cells D90:K98 – Average Check Size per Person
In this section, you simply input the average check size per person for year 1 and you can grow each F&B category by a certain percentage each year.
F&B Expense Inputs
In this section, there are a few options to project the correlated F&B expenses. Clicking Cell E105 and having the Simple option active, allows you to use one input for all the expenses for the specific F&B offering that is a percentage of revenue for each F&B item. See Cells F114:J114.
Clicking Cell E106, Detailed Line Items, opens up a new section and allows the user to break out specific costs by line item. As with the Simple scenario, for each line item, you will need to input the cost as a percentage of revenue.
Control Costs Yearly?
Clicking Yes, Cell E127, will allow you to control the costs of each F&B offering going forward. Please note that the first year is already provided from the inputs above. This is so you can work on detailed cost items and it will copy over here. Then, you can control costs in aggregate for each F&B item. If you select No, Cell E126, then the costs will remain the same percentage of revenue over the whole term.
Individual F&B Offering Revenue Review
Cell N5 is a drop down menu that allow you to select one of the F&B offerings and review them in detail in the table to the right, Cells P4:AA17. Choosing an F&B offering will alter the table according to the respective inputs for the option selected and you can review for further analysis.
Total F&B Revenue, Total F&B Expenses, and Expense/Revenue Sections
These are the tables below the Individual F&B Offering Revenue Review section. These show all the F&B revenue and expenses in isolation from the rest of the proforma so you can quickly see the cash flow as you make alterations.
Tutorial 5 – OthOppDepts Tab (Other Operating Departments Inputs)
This tab covers other profit centers outside of F&B and hotel rooms.
Other Operating Department Revenue
Here you have the ability to add five separate departments in cells G8:G12. Upon downloading the model, we have only input three: Space Rental, Spa, and Gift Shop. To the left of the department inputs (Cells D8:E12) is where you will select the methodology you want to use to project revenue in the future for each department. By clicking annual growth rate, you can put in your year 1 revenue projection in column H and apply an annual growth rate in column I. Selecting Custom Growth Rate will enable you to manually put in the revenue for each year within the Revenue Cash Flow box. The total revenue from each department is summed up in row 13.
Other Operating Department Expenses
As with the revenue section, in the expense section you also have the ability to do a Simple input or Custom Yearly inputs for expenses as a percent of revenue.
Other Operating Departments Worksheet Video
Tutorial 6 – OthExpenses Tab (The Remaining Expense Inputs)
This tab provides the inputs for Room Expenses, Undistributed Expenses, Franchise Fees, Management Fee, Fixed Expenses, and Cap Ex and FF&E Reserve.
Room Expenses
In this section, you will put the cost per occupied room in to Cell H7. you can either have a static growth rate by making sure Static, combined Cells E7:E8, is clicked and putting in the annual growth rate in Cell I7 or you can select combined Cells D7:D8 and put in a different growth rate for each year in row 8.
Undistributed Expenses
There are five separate Undistributed Expense items that are fairly common that have been placed in Cells G14:G54: G&A, Sales and Marketing, I/T, Repair and Maintenance, and Utilities. If you want / have other expenses, you can change these items to different categories if need be. Credit Card fees were also input into the current version (1.0) of this model although they are an expense that is more commonly attributable to the operating departments accordingly. The updated model will have this replaced and/or removed.
For projecting these expenses in the model, you have four different options to choose from in 4 out of the 5 line items. The second line item, where credit card fees are inserted (Row 24) is static and you can only grow the expense out using one growth rate.
Let’s use Rows 14:15, G&A to describe how the expense projection optionality works. With cells D14 and E14 you can select to calculate expenses as either a percent of revenue or manually putting in year in expenses and using an annual growth assumption. In cells D15 and E15 you can choose your growth projections as a Custom Input for each year or one static input to apply to the total hold period.
So the options are as follows:
- % of Revenue (D14) and Custom Input (D15) – with this option in cells K15:U15, you manually put in a percent of the revenue and the value is shown in row 14 above.
- % of Revenue (D14) and Static (E15) – with this option, you put in the expense as a percent of revenue in cell H14 for the entire hold period.
- Annual Growth (E14) and Custom Input (D15) – In Cell H15, input your year 1 expense and in cells L15:U15 input the growth rate for each year.
- Annual Growth (E14) and Static (E15) – In Cell H15, input your year 1 expense and in combined cells I14:I15 input the growth rate for each year.
Again, this is the same for all the other Undistributed Expenses except for the section with the Credit Card fees, row 24.
Franchise Fees
This section includes all the typical items that might be included in a franchise fee such as the initial fee, royalties, marketing fees, reservation fees, and a fifth option for other fees that might not have been included.
For the initial fee, you put in the amount (Cell H65) and you can select what year that amount should be paid (Cell I65). This functionality is in here in case you are going to reflag or may be there is some other reason you will need to pay a one time fee. If this is not needed, you can simply put a zero in Cell H65.
All the other fees in here are base don a percent of revenue and have the ability to be projected with a Static input or Custom for each year. This works the same as described in the other sections.
Management Fee
The Management Fee section, starting in Row 80, provides an option to input a base fee as a percent of Gross Revenue. You have the usual option of a static percentage over the hold or you can do a custom input for each year.
For the incentive fee, you have three options for projecting the costs as follows:
- From Line Item in Proforma (Cell D87) and Static (Cell E88) – using this option, in Cell H88, you can select from three options to base the incentive fee on: Total Revenue, Total Departmental Profit, and Gross Operating Profit; and put in the percent of the line item to be paid to management in Cell I87.
- From Line Item in Proforma (Cell D87) and Custom (Cell D88) – select from the three options in cell H88 as described above and put in the percent of the line item to be paid to management in each year in cells K88:U88.
- Custom (Cell E88) – with this option you can manually put in your incentive fees for each year in cells K87:U87.
Fixed Expenses
This section is for taxes and insurance. For taxes, put in the assessed value, mill rate, and annual growth projection in cells E94:E96 and for insurance you can put in the amount in year 1 and the annual growth projection in cells E:100:E101.
Cap Ex and FF&E
For the Cap Ex and FF&E reserve, it is based on a percent of gross revenue and you can select the option to the left for a static input or custom inputs for each year.
Row 110 allow you to put in a custom amount in any year for any anticipated major cap ex projects.
Other Expenses Worksheet Video
Tutorial 7 – Penetration Tab (Penetration Analysis)
A critical component to assessing any hotel is to compare the hotel to the local market comp set. There are few resources out there that provide this data with the most popular group being STR (pronounced Star).
Competitive Set
In this section, you will put in the room count for up to 10 hotel comps. As with the remainder of this section, you will input historical data looking five years back. Upon completion you can look to row 19 for the total available room nights of the comp set in each year. Row 21 and down shows the subject property with inputs from the Summary tab. This shows what percent of available inventory is our subject property. In this case, it is 17.1% of the competitive inventory with the property’s room count as part of the denominator.
Market vs. Property Occupancy
In this section, you will input both the historical and projected competitive set occupancy rates. Row 32 is derived by dividing the subject property’s occupancy rate by the competitive set’s. If this number is below 100%, then the subject property is under performing in booking room nights compared to the competition, above 100% and the subject property is outperforming the comp set. In our example, we start at 78.7% and end at 102.2%. This could be an investor looking to reposition the property. The $8MM in Cap Ex in year 2 that we saw on the OthExpenses tab is possibly another clue as to this investor’s intentions.
Market vs. Property ADR
In row 35 you put in the historic and projected ADR of the comp set and in row 32 you can analyze the ADR penetration of the subject property by year.
Market vs. Property RevPAR
In this section, there are no inputs needed as the model has already calculated all the pertinent data. Row 46 shows the RevPAR penetration.
Penetration Worksheet Video
Tutorial 8 – Waterfall – IRR Hurdles Tab
This tab contains a standard 4-tier IRR hurdle waterfall model to distribute proceeds between the general partner and limited partner. You have the ability to adjust the equity contribution split as well as the tier 1 proceeds split, and promote and hurdle rate in each tier. All the assumptions can be altered using the blue cells in the Promote Structure box in cells B4:C24. Please watch the video below that will walk you through how to use it.
Waterfall Video
Frequently Asked Questions about the A.CRE Hotel Valuation Model in Excel
What are the key tabs in the A.CRE Hotel Valuation Model?
The main tabs covered in the tutorials include:
Summary
CFSummary (Cash Flow Summary)
OpCashFlow (Operating Cash Flows)
F&B (Food & Beverage)
OthOppDepts (Other Operating Departments)
OthExpenses (Remaining Expenses)
Penetration (Competitive Market Analysis)
Waterfall – IRR Hurdles
Each tab has unique inputs and outputs tailored to hotel underwriting.
What inputs are found in the Summary tab?
The Summary tab includes essential inputs on the left-hand side in blue font. These drive the model and include assumptions such as hold period, entry/exit metrics, and leverage details. It also summarizes key investment metrics for quick review.
How are Food & Beverage revenues modeled?
The F&B tab allows inputs for up to five offerings (e.g., Restaurant, Bar). You can input average guests per room, percentage of room guests using each offering, check sizes, non-hotel patronage, and choose between static or yearly growth projections.
What does the Penetration tab analyze?
The Penetration tab compares the subject hotel’s performance against its comp set across occupancy, ADR, and RevPAR. It calculates penetration percentages and allows for historical and projected inputs over a five-year period.
How are Operating Departments other than Rooms and F&B handled?
In the OthOppDepts tab, you can input up to five other revenue-generating departments (e.g., Spa, Gift Shop). Revenue and expense projections can be based on annual growth rates or custom yearly inputs.
What options exist for projecting expenses in the OthExpenses tab?
This tab supports flexible projections for Room Expenses, Undistributed Expenses, Franchise Fees, Management Fees, Fixed Expenses, and FF&E Reserves. Each line item can be projected using static or custom growth rates, percent of revenue, or fixed amounts.
How is the incentive management fee calculated?
You can base the incentive fee on Total Revenue, Departmental Profit, or Gross Operating Profit. The model supports both static and year-by-year percentages or allows for direct manual input by year.
What is the purpose of the Waterfall – IRR Hurdles tab?
This tab models a four-tier IRR hurdle structure to distribute cash flows between General and Limited Partners. You can customize equity splits, hurdle rates, and promote percentages using inputs in the blue cells.
Do I need to enable macros for the model to work?
Yes, the model includes macros. Upon opening, you should enable content if prompted with a security warning. The model will not function correctly without macros enabled.