Bonus Content – Gantt Chart and Weighted Average with Multiple Conditions
I have two updates/improvements to previous posts I thought I’d share with our readers today; call it, bonus content! The first, is a dynamic Gantt Chart tool I recently added to my Construction Draw and Interest Calculation Model. The second, is an enhancement to my post on writing conditional weighted average formulas that shows you how to include multiple conditions in your weighted average formulas. Both items, on their own, probably don’t justify a new post but together they certainly do.
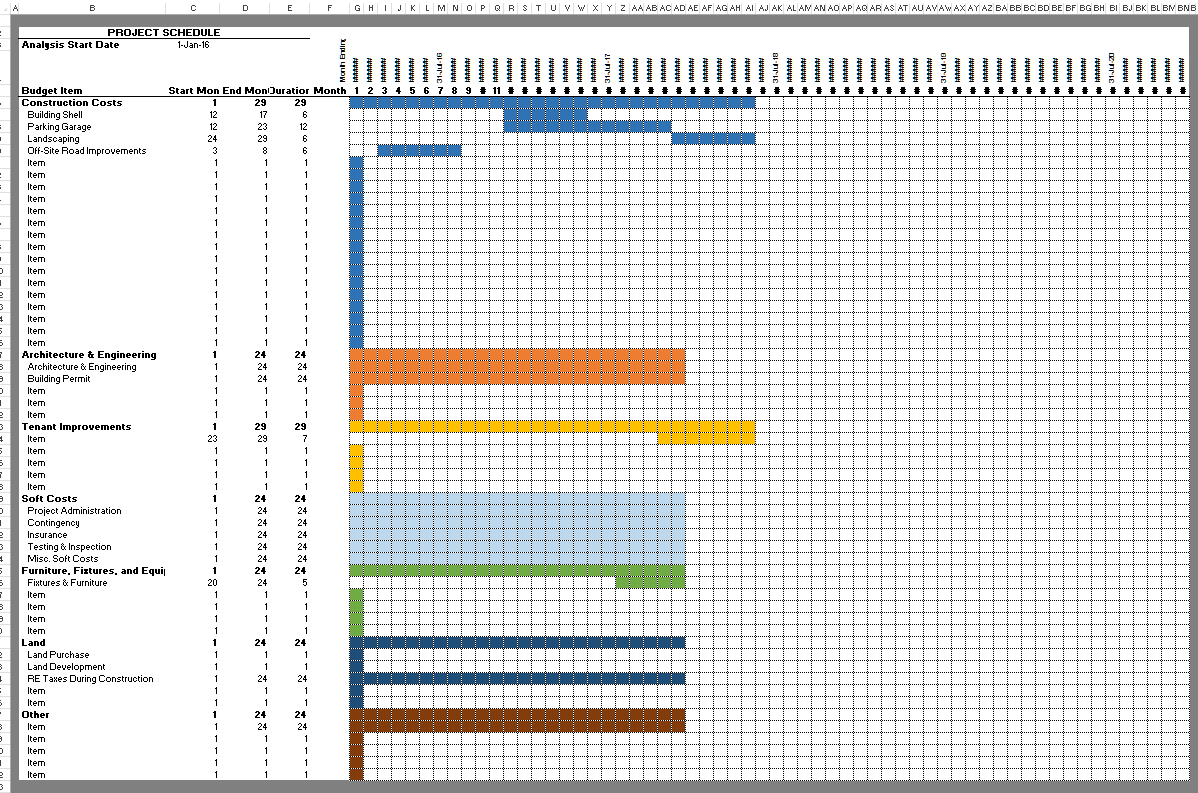
Screenshot of my dynamic, Gantt Chart tool for development budgeting
The Dynamic Gantt Chart for Real Estate Development Budgeting in Excel
The genesis of this tool was a question/challenge from a friend a few months back. He had been tasked to build a Gantt chart to go along with a development budget he was modeling and he wanted a to know if there was a way to make the Gantt dynamic. It was an interesting challenge. I had actually tried to do this very thing a long time ago before my Excel skills were decent and had failed miserably. So when he asked me for help, I thought I’d take a second crack at it.
The second time around, this many years later, was much easier and it got me thinking. Why not add one of these to my construction draw model? And so I did. You can check out the updated post and download the new version 2.0 here:
Construction Draw and Interest Calculation Model
Building this is actually quite simple if you’re comfortable with your ‘Conditional Formatting’ skills. The basic concept is that each cell in the Gantt chart is conditioned to change colors based on the information found in the budget timeline (‘Budget’ tab), making the chart dynamic to changes to the timeline.
Each cell in the chart represents a specific time period (months in this case) for a given budget item. I first wrote a formula in each cell of the Gantt chart that asked: is there work occurring on this budget item in this month? The cell then outputs either a TRUE, if there is work occurring in that period or FALSE if not. I next changed the font color of those TRUE/FALSE cells to white to hide the result.
Finally, I wrote custom conditional format logic in each cell that highlights the cell a specific color (different colors assigned to different budget categories) if the cell is TRUE, if not than it leaves the cell white. The result is a dynamic Gantt chart based on the budget timeline in the ‘Budget’ tab.

Bonus Content + Beautiful Scenery = Happy Modeling!
Adding Multiple Conditions to the Conditional Weighted Average – SUMPRODUCT with SUMIF Concept
If you recall, earlier this year I introduced a time saving formula for finding the weighted average of specific elements in a list. For instance you can use this formula to find the weighted average rent of only certain tenants (the condition) in a rent roll without pulling those tenants out separately to make that calculation.
You can read the original post on the conditional weighted average formula here:
Conditional Weighted Average Formula
What I didn’t realize at the time and only recently discovered when the need arose, was that you can include multiple conditions in the formula. So for instance, in the original post I posted this syntax for writing the formula:
= SUMPRODUCT(–(Conditional Array = “Condition”),Array1, Array2)/SUMIF(Conditional Array,”Condition”,Array2)
However, you can add more conditions immediately following the first to limit even further the values that are included in the SUMPRODUCT calculation. The SUMPRODUCT portion of the formula looks like this:
= SUMPRODUCT(–(Conditional Array = “Condition 1”),–(Conditional Array = “Condition 2”),Array1, Array2)
The tricky part then comes in dividing the SUMPRODUCT result by a value (using SUMIF) that makes sense. To explain how to do this, allow me to use an example.
The Example – What to Divide our SUMPRODUCT Value By
Imagine you have a rent roll with 100 office and retail tenants in three different buildings and you want to quickly calculate the weighted average rent of the Retail Tenants in Building One only. How do you do this?
Well first, you’ll write the SUMPRODUCT formula discussed above with Retail Tenant as one condition and Building One as the other. The result will be a sum of the rent of each Retail Tenant in Building One multiplied by their respective rentable area (in square feet). To get the weighted average, we must then divide that value by the SUM of the rentable area of all Retail Tenants in Building One.
I would do this by writing a SUMIF formula to add up the square feet of all tenants in Building One and then subtract out the square feet of the Office Tenants in Building One to get the total square feet of Retail Tenants in Building One.
This SUMIF formula would look something like this:
(SUMIF(Conditional Array,”Condition – Building One”,Array2) – SUMIF(Conditional Array,”Condition – Office Tenants”,Array2)
And when we put the SUMPRODUCT and SUMIF components of the conditional weighted average formula all together, the formula we end up with would look something like this:
= SUMPRODUCT(–(Conditional Array = “Condition 1”),–(Conditional Array = “Condition 1”),Array1, Array2)/(SUMIF(Conditional Array,”Condition – Building One”,Array2) – SUMIF(Conditional Array,”Condition – Office Tenants”,Array2)
And with that formula the cell would display the weighted average of Retail Tenants in Building One.
If you have any questions or spot an error in my method, please let me know.
Frequently Asked Questions about the Bonus Content – Gantt Chart and Weighted Average with Multiple Conditions
What is the new dynamic Gantt Chart tool introduced in this post?
It’s a visual scheduling feature added to the Construction Draw and Interest Calculation Model. The chart uses conditional formatting in Excel to dynamically reflect budget timeline data. “Each cell in the chart represents a specific time period… and outputs either a TRUE or FALSE,” which then triggers the cell to change color based on the project phase.
How does the conditional formatting in the Gantt Chart work?
Cells in the chart calculate whether work is occurring in a given month and output TRUE or FALSE. The font color is changed to white to hide these values, and then “custom conditional format logic… highlights the cell a specific color” if the result is TRUE.
Where can I download the model that includes the Gantt Chart tool?
You can download version 2.0 of the model from the updated post titled Construction Draw and Interest Calculation Model. A direct link is included in the blog post.
What is the improvement made to the conditional weighted average formula?
The update shows how to include multiple conditions in a weighted average formula using Excel’s SUMPRODUCT with multiple logical checks. As Spencer notes, “You can add more conditions immediately following the first to limit even further the values included.”
Can you give an example of using multiple conditions in a weighted average formula?
Yes. The example involves calculating the weighted average rent of Retail Tenants in Building One from a rent roll. The formula uses SUMPRODUCT to filter based on both tenant type and building, and then divides by the total square feet of only those tenants.
How do you calculate the denominator when multiple conditions are involved?
Spencer suggests using two SUMIF functions: one for the total square feet of tenants in Building One, and another to subtract out Office Tenants. The formula looks like:
(SUMIF(Conditional Array,”Condition – Building One”,Array2) – SUMIF(Conditional Array,”Condition – Office Tenants”,Array2))
Where can I find the original post on conditional weighted averages?
You can read the original post on the time-saving conditional weighted average formula by following the link titled Conditional Weighted Average Formula included in this bonus content post.