Limitations of IRR When Evaluating Real Estate Investments
The internal rate of return is one of the most commonly used return metrics to analyze real estate investment opportunities. Simply put, the IRR is the anticipated, project-determined discount rate an investor is expected to earn over the life of the investment if the investment performs as projected.
An example of how it works is shown below:
Are you an Accelerator member? Check out courses 3, 4, and 5 of the Core Curriculum for how to use IRR (and XIRR) in your real estate analysis. Not yet an Accelerator member? Consider joining the real estate financial modeling training program used by top real estate companies and elite universities to train the next generation of CRE professionals.
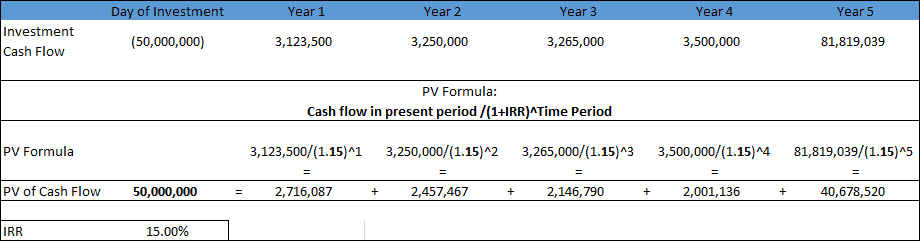
In this example, the investor is projected to earn a 15% IRR over the life of the investment. A good return, right? Well, it’s a bit more complicated than that.
Although the IRR is a metric widely used in commercial real estate, it does not tell the complete story and should be one of many metrics to use when considering if a potential real estate investment is worth the time, money, and risk. In this post, I’ll discuss how and when to use IRR, and share a few of the limitations of using IRR in real estate investment analysis.
Illustrating the Problems of Solely Depending on the IRR
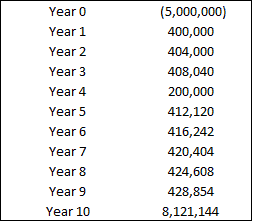
To illustrate the limitations of solely depending on the IRR, examine the difference between the two cash flows below that both have the same initial investment of $4MM, a hold period of 10 years, and an IRR of 12%. If unsure how to calculate IRR, you might review our deep dive on using IRR vs XIRR in Excel or our discussion on why IRR and XIRR return different values.
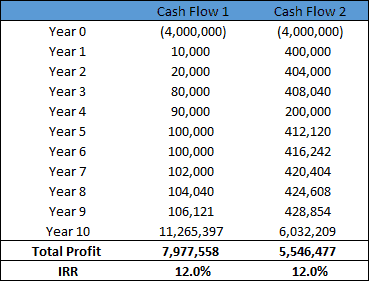
Upon examining the table, it becomes clear that the IRR alone will tell us nothing about actual periodic payments or total profitability. There can be an almost infinite variability in cash flow streams and total profit that will equal a 12% IRR.
For example, Cash Flow 1 has very little annual cash payouts relative to the amount invested, but a large payout in Year 10 and Cash Flow 2 has much higher annual payments, but the payout in Year 10 is almost half of the payout for Cash Flow 1. We can also see that IRR says nothing about total profitability as Cash Flow 1 has almost $2.5MM more in total profit.
You might also enjoy our deep dive into Cash-on-Cash Return, when it matters, and when it doesn’t.
A Few More Examples to Hit the Point Home
To further elaborate on the limitations of over depending on the IRR, let’s assume an investor has $5MM to invest into commercial real estate. Our investor would preferably like to receive a decent annual return from the property in addition to realizing a decent profit from the property appreciation when he exits.
He would like to hit a 10-15% IRR, depending on the deal and is willing to consider all opportunities. He reaches out to a reputable broker to help source the deal. The broker sends him two offering memorandums with the following opportunities and information:
Deal 1 – Office Opportunity
- Equity Needed: $5MM
- Hold Period: 5 Years
- IRR: 15%
- Developer/Operator: Very Experienced
- Description: Great opportunity to reposition an office asset in a great market.
Deal 2 – Retail Opportunity
- Equity Needed: $5MM
- Hold Period: 10 Years
- IRR: 11%
- Developer/Operator: Very Experienced
- Description: Great opportunity to reposition a retail property in a great market
Just based off this information alone, it appears that the office deal would be the clear winner. All things considered equal, it appears our investor is going to get a higher return on his investment and in half the time. The IRR comparison clearly shows this and in addition, he has confidence in the developer/operator because he’s heard of them and knows they are very experienced.
Feeling good about the opportunity at a high level, the investor opens the OM and is greeted with slick pictures and a summary page with the following table and cash flow:
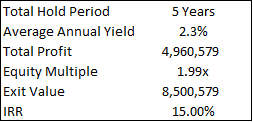
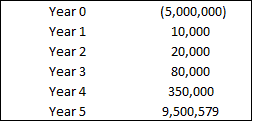
One of the things he immediately notices is that the average annual yield is surprisingly low at 2.3% meaning that the main impact driving the 15% IRR must be coming from significant appreciation and sale of the property.
Looking at the cash flow further confirms this. He sees that Year 1 cash flow provides a 0.2% return and in subsequent years the cash flow is growing by a significant amount.
Now he can assume with strong confidence and without looking further into the OM that this is an opportunistic deal and the sponsor is most likely looking to purchase an almost vacant office building, possibly do some renovations and hope to lease up the entire building in years 4 and 5 and exit with a stabilized and much more valuable building.
The IRR alone could not give him this information and could not really give him a level of understanding about the risk involved. This deal is risky. Now, although still at a high level, the additional metrics and annual cash flow information gave him much more to work with. He is still considering the deal because he has a lot of confidence in both the operator and the market, but realizes that it may not be the right one for him.
- You might check out our IRR Matrix Excel model to further understanding how IRR changes over hold period.
Digging Deeper into the IRR
A little unsure now, he decides to look at the other project, although a little less enthusiastic about the IRR. Upon opening the second OM, he sees the following table and cash flow:
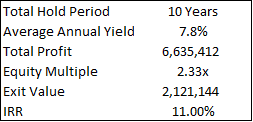
The summary cash flow and additional valuation metrics immediately reveal a lot more about the opportunity. Although the IRR is much lower, he is happy with the attractive annual yield that averages 7.8%. This deal appears to be much more stable and much less risky than Deal 1.
He can assume this because there is a steady cash flow stream with a solid annual return and a moderate to very good property appreciation assumption that seems appropriate for a building in decent shape over the ten-year hold (4% – 5% annual appreciation. Year 10 total cash flow = exit price + operating income).
However, one cause for concern should be Year 4 cash flow, which most likely indicates a major tenant or multiple tenants’ vacating. This will be something that needs to be better understood by our investor.
Using Equity Multiple as a Companion Metric to IRR
Further consideration when comparing the two deals should be to look at the total profit. The equity multiple is a quick way to see how much you’ve earned over your initial investment.
Deal 1 has a 1.99x multiple meaning that our investor could almost double his money if all goes well and in Deal 2, there is a 2.33X equity multiple. As a result, Deal 2 earns an additional $2.6MM of profit compared to Deal 1, but Deal 2 requires a 10-year commitment compared to 5 years for Deal 1.
Is the additional 5 years, supposed less risk, and additional $2.6MM of potential profit a better proposition for our investor? He will need to think about this and many other issues as he continues his due diligence.
Wrap Up the Discussion on IRR
Although still at a high level, our investor now has a much better understanding of the two deals he has been presented with. It should be clear now that the IRR, although an extremely valuable and useful metric to help measure profitability, is not great at directly conveying risk, cash flow profile, and absolute profitability; and should be used in combination with the other metrics mentioned here, as well as others to value real estate opportunities.
Frequently Asked Questions about the Limitations of IRR When Evaluating Real Estate Investments
Why is IRR not always a complete indicator of investment performance?
IRR does not reflect actual cash flow timing, total profitability, or risk. As the article states, “There can be an almost infinite variability in cash flow streams and total profit that will equal a 12% IRR.” Two investments may have the same IRR but differ significantly in annual returns and overall risk.
Can two deals with the same IRR offer different risk and profit profiles?
Yes. For example, Deal 1 had a 15% IRR over 5 years with low annual cash flow and relied on appreciation, while Deal 2 had an 11% IRR over 10 years with steady cash flow and less risk. Despite a lower IRR, Deal 2 had a higher equity multiple and total profit.
What are some limitations of IRR highlighted in the article?
Doesn’t show cash flow consistency or timing
Doesn’t convey total profit or equity multiple
Doesn’t account for risk or investment volatility
Can be misleading when used alone without additional metrics
What metrics should be used alongside IRR?
The article recommends reviewing the equity multiple, cash-on-cash return, annual cash yield, and analyzing cash flow patterns to complement the IRR. These provide a fuller picture of risk, cash flow stability, and profitability.
How does the equity multiple help in evaluating deals?
The equity multiple shows how much total profit is earned on the investment. For instance, Deal 1 had a 1.99x multiple, while Deal 2 had a 2.33x multiple, meaning Deal 2 yielded $2.6MM more in profit despite a lower IRR.
Why might an investor still consider a lower-IRR deal?
A lower-IRR deal may offer more stable annual returns, lower risk, and higher overall profit over a longer hold period. In the example, the 11% IRR retail deal had more attractive annual yields (7.8%) and appeared more stable than the riskier 15% IRR office deal.
What is the key takeaway regarding IRR from the article?
“IRR… is not great at directly conveying risk, cash flow profile, and absolute profitability; and should be used in combination with other metrics… to value real estate opportunities.” Investors must look beyond IRR to make informed decisions.


