Using the Cash-on-Cash Return in Real Estate Investment Analysis (Updated Aug 2024)
I’ve fielded a handful of Cash-on-Cash (CoC) return questions of late. So, I thought it would be worthwhile to write a post on what the Cash-on-Cash return metric tells me about a potential real estate investment. This article is a primer, if you will, on when this metric is helpful to use in your analysis and when it is not.
Are you an Accelerator member? This concept is explored in-depth in our ‘Calculating Key Risk and Return Metrics’ course. You can find that course here. Not yet an Accelerator member? Consider joining the real estate financial modeling training program used by top real estate companies and elite universities to train the next generation of CRE professionals.
What is Cash-on-Cash Return?
In real estate, Cash-on-Cash return is the before tax cash flow (i.e. Cash Flow after Financing) of an investment in a given period divided by the equity invested (i.e. total equity capital invested) as of the end of that period. Cash-on-Cash return is a levered (after debt) metric, whereas the Free-and-Clear return is its unlevered equivalent. The metric used by real estate investors to assess potential real estate investments.
How to Calculate Cash-on-Cash Return in Real Estate
Let’s use a quick example to demonstrate how to calculate Cash-on-Cash return. An office building is expected to produce $200,000 in before tax cash flow in the year 2021. Furthermore, the prospective owners of the office building expect to have invested $2,750,000 in equity capital as of the end of 2020.
To calculate the expected CoC return in 2020 for this investment, you simply divide the before tax cash flow (BTCF) by the equity invested (Equity Invested) as of the end of the period.
200,000 ÷ 2,750,000 = 7.27% CoC
Download one of our Excel real estate financial models to see the Cash-on-Cash return in practice. You might check out our All-in-One (Ai1) model, Apartment Acquisition Model, or Office, Retail, Industrial Acquisition model as examples.
The Cash-on-Cash Return is Just One Metric Among Many
First a short rant. Too many people throw this metric around as if it’s the end-all-be-all of real estate analysis. It’s not. It’s just another metric that tells you something about the investment in the same way the IRR, Equity Multiple, Yield-on-Cost, Debt Service Coverage, Debt Yield, and other metrics tell you something about the investment.
The reality is, every metric has its place but no metric gives the whole story. Take the IRR as an example. It’s used almost universally as the primary real estate investment return metric, and yet it has serious limitations; like any other metric. My co-contributor Michael offered an excellent analysis of the limitations of IRR, and a similar post could be written on every metric we use in our CRE analysis.
Therefore, your responsibility as a real estate professional is to understand what a metric is telling you, and what it is not telling you. Then, with the right information, you’ll be more prepared to make a wise investment decision.
When the Cash-on-Cash Return is Useful
So, you can calculate a CoC return, but when is it useful in your analysis? The Cash-on-Cash return is an operating cash flow metric. Essentially, it tells us how much net operating cash flow in each period is left relative to the amount of equity invested by the partners. Therefore, the Cash-on-Cash return is most useful when the partners care about consistent positive cash flow during operation.
Here are a few examples of when the Cash-on-Cash return might be especially important:
- A 73-year-old retiree plans to invest $1,200,000 in the purchase of a long-term investment property. She hopes to live off the income from the property, and she needs at least $90,000 a year before taxes to cover her living expenses. Consequently, she targets a minimum 7.50% annual CoC return when analyzing prospective investments.
- A real estate private equity firm is raising capital for a new, closed end core investment fund. Prospective investors in the fund are expressing a desire for quarterly cash flow distributions of at least 1.5% of invested capital. The fund charges an 80bps asset management fee, and so the managers of the fund conclude they will seek investments with consistent income and a minimum annual CoC return of 6.80%.
- An endowment has partnered with an experienced developer to execute a nationwide build-to-core investment strategy. The endowment is seeking to develop investment property at a discount to acquisition price, and then hold the newly built and stabilized investments long-term. The endowment seeks to payout 6.0% of its total capitalization each year to its beneficiary, and so in underwriting prospective development opportunities it targets a stabilized annual CoC return of at least 6.0%.
When the Cash-on-Cash Return is NOT Useful
While there are situations where the CoC return is one of the more important metrics to consider, there are just as many situations where it adds little to no value to the analysis.
Here are a few examples of when the Cash-on-Cash won’t be especially helpful:
- A merchant (build to sell) developer runs a regional multifamily development platform. The developer’s strategy involves identifying buildable sites within walking distance of mass transit, building 250-350 unit mid-rise projects, leasing up the properties as quickly as possible, and then selling the fully stabilized properties to institutional owners. Since the developer does not hold the properties long-term, he pays little attention to the CoC return and instead focuses on Equity Multiple and Development Spread (Yield-on-Cost minus Market Cap Rate).
- A family office targets value-add opportunities. The strategy involves purchasing under leased office buildings, investing in common area and exterior improvements, and stabilizing the properties. The company times its exits based on market conditions. Since the company’s strategy creates significant value through the renovation and stabilization phases of its investments, the amount of cash flow that the property generates during the stabilized operation phase – as represented by CoC return – is much less important.
- A single-family home investor purchases distressed, bank-owned homes. She makes minor renovations and improvements to the homes and then “flips” them to subsequent owners 4-6 months later. The investor uses high interest rate (12%+), hard money loans to purchase the homes with little or no money down. She sometimes rents the homes out after renovation, but given the high interest rate, the debt service payment is still generally greater than the net income available to pay debt service. As a result, paying attention to CoC return would be futile.
A Quantitative Example: 18.3% Average Annual CoC return but a -2.8% Levered IRR
Is it possible to have a solid, consistent Cash-on-Cash return but still lose money on an investment? Absolutely! That’s why I wrote this article – to illustrate what a CoC return does, and does not, tell you about an investment.
Imagine you’re offered the opportunity to purchase a baseball stadium for $1,200,000. A local minor league baseball team has five years remaining on its lease, with annual payments of $100,000. If you were to pull the trigger on this investment, you would seek to borrower $900,000 from a local bank with estimated annual interest-only debt service payments of $45,000. This would require a $300,000 equity investment.
During your due diligence, you learn the team has decided to move to a new, larger stadium at the end of its lease term. With no team available to rent the stadium, you conclude the only appropriate thing to do when the team vacates is to tear the stadium down and sell the land. In researching that possibility, you learn it will cost $100,000 to scrape (i.e. tear down) the stadium, and that the underlying land is worth about $1,000,000.
What is the Average Annual Cash-on-Cash return of this potential investment? How does that compare to the levered internal rate of return and net profit on the investment?
Let’s look at the numbers (Download the Excel file below).
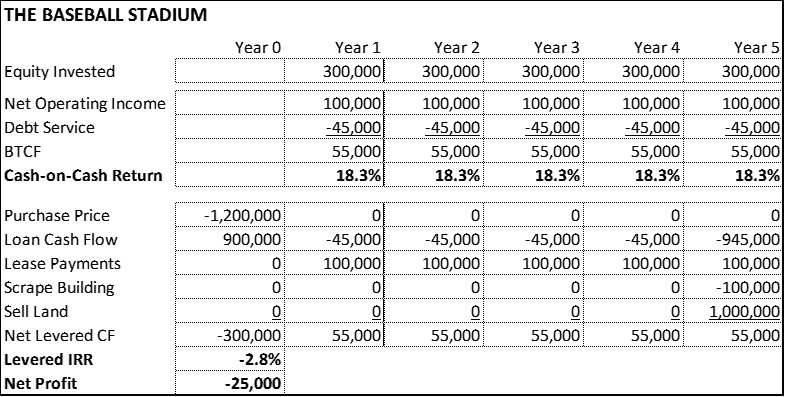
Since during operation (Years 1-5) there is steady cash flow, the resulting average annual CoC return is 18.3%! A pretty good deal, right? Not at all. Since the property is only worth $900,000 at the end of the investment period ($1,000,000 land minus $100,000 to scrape the stadium), the investment actually loses money (-2.8% levered IRR and -$25,000 net profit).
- Calculations for CoC return example
- Basic Excel file
Frequently Asked Questions about the Baseball Stadium Case Study v1.1
What is the purpose of the Baseball Stadium Case Study v1.1?
The case study is designed to help users understand financial modeling concepts such as return calculations and the Cost of Capital (CoC) through a simplified stadium investment scenario using Excel.
What calculations are included in the Excel file?
The Excel file includes calculations for CoC return examples. This likely involves projecting cash flows, applying discount rates, and estimating net present value or internal rate of return. [Exact formula details are not specified in the post]
Is this a complete financial model or a simplified example?
It is described as a “Basic Excel file,” so it appears to be a simplified example focused on illustrating core concepts rather than a full-scale model.
What financial concept is primarily taught in this case study?
The main focus is on calculating returns using Cost of Capital (CoC) metrics. The phrase “Calculations for CoC return example” suggests that users are guided through how to compute investment returns with CoC in mind.
How many times has this file been downloaded?
According to the post, the file has been downloaded 3,600 times.
What version of the case study is this?
This is version 1.1 of the Baseball Stadium Case Study.
Can this file be used for teaching or classroom use?
While not explicitly stated, the structure of the case study and its simplified Excel format suggest it is appropriate for educational purposes, particularly for illustrating basic financial concepts like CoC and returns.
Final Thoughts
Thus we see, Cash-on-Cash return tells us very little about the overall profitability of a potential real estate investment. It is a great metric for helping us understand how much cash flow the property might throw off during the operation period, and for many investors that is an important consideration. But that’s the extent of the metrics usefulness. Understand it and use it, but know its limitations.
For those looking to deepen their understanding and enhance their analytical skills, consider exploring our new Data Analysis GPT for Commercial Real Estate. This tool uses AI technology to help streamline your complex data analysis tasks. Whether it’s enhancing your hold-sell analyses like we discussed in this article or tackling other data-intensive tasks in CRE, the Data Analysis GPT can provide powerful support.
Frequently Asked Questions about Using the Cash-on-Cash Return in Real Estate Investment Analysis
What is Cash-on-Cash Return in real estate?
Cash-on-Cash Return (CoC) is the before-tax cash flow (i.e., cash flow after financing) in a given period divided by the total equity capital invested. It is a levered return metric used to assess operational cash yield. “Cash-on-Cash return is a levered (after debt) metric, whereas the Free-and-Clear return is its unlevered equivalent.”
How do you calculate Cash-on-Cash Return?
Use the formula:
CoC Return = Before-Tax Cash Flow ÷ Equity Invested
Example:
$200,000 ÷ $2,750,000 = 7.27% CoC Return
When is the CoC Return most useful in investment analysis?
CoC return is most useful when investors prioritize consistent operating income over long-term appreciation. Examples include: retirees seeking income, funds offering regular distributions, and endowments requiring annual payout benchmarks.
When is the CoC Return NOT useful?
CoC is less relevant when cash flow is not the primary return driver. This includes:
Merchant developers flipping projects
Value-add firms focusing on asset repositioning
Fix-and-flip investors using high-interest leverage
In these cases, metrics like IRR or Equity Multiple are more informative.
Can you have a high CoC Return but still lose money?
Yes. In the baseball stadium case study, the investment shows an 18.3% average annual CoC return but results in a -2.8% IRR and a $25,000 loss, due to poor terminal value and costly demolition.
What does CoC Return NOT tell you about an investment?
It does not reflect total profitability or account for exit value, time value of money, or non-cash events. “Cash-on-Cash return tells us very little about the overall profitability of a potential real estate investment.”
How does CoC Return compare to IRR or Equity Multiple?
While CoC measures annual operating yield, IRR and Equity Multiple account for total return over time, including appreciation and sale proceeds. CoC is a snapshot, while IRR and Equity Multiple provide a complete investment picture.
Where can I practice using CoC Return in Excel models?
Try the All-in-One (Ai1) model, Apartment Acquisition Model, or Office/Retail/Industrial Acquisition models available on A.CRE. These include built-in CoC return calculations you can explore and customize.


